Download
1 / 11
110 likes | 232 Views
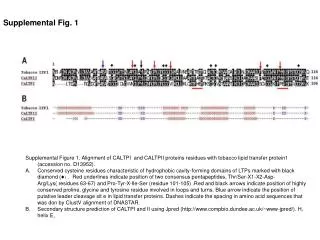
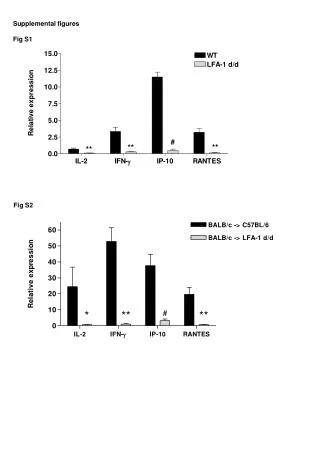
Supplemental Fig. 1. Supplemental Fig. 1 Relative changes in liver weight

E N D
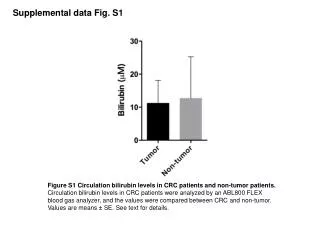
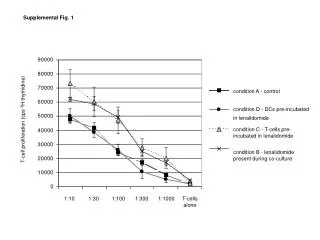
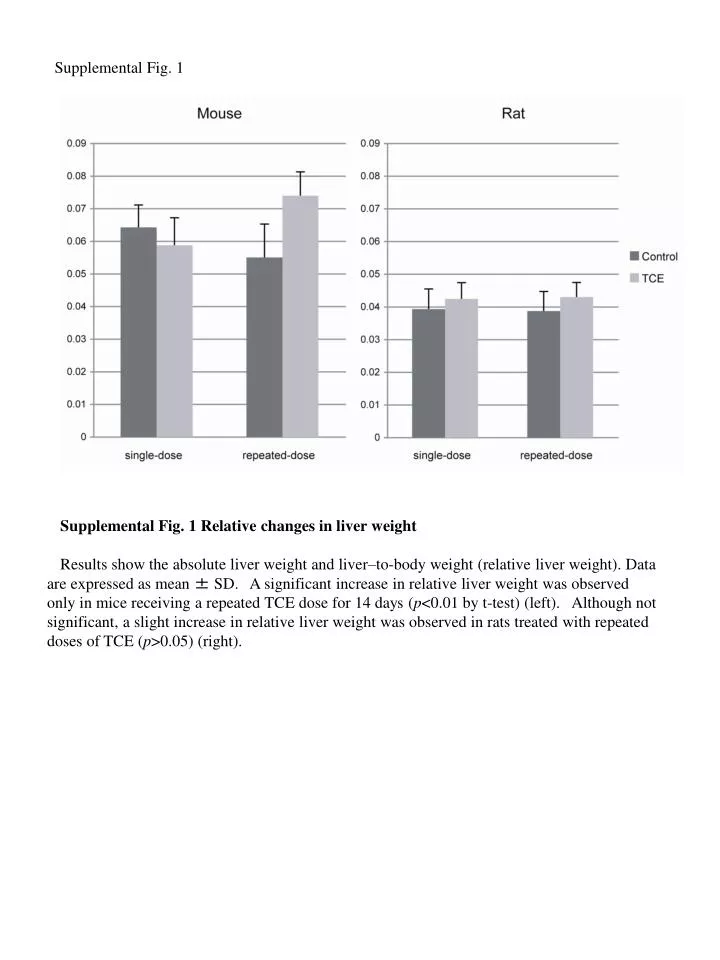
Supplemental Fig. 1 Supplemental Fig. 1 Relative changes in liver weight Results show the absolute liver weight and liver–to-body weight (relative liver weight). Data are expressed as mean ± SD. A significant increase in relative liver weight was observed only in mice receiving a repeated TCE dose for 14 days (p<0.01 by t-test) (left). Although not significant, a slight increase in relative liver weight was observed in rats treated with repeated doses of TCE (p>0.05) (right).
Supplementary Fig. 2 Complement and coagulation cascade A. Mouse B. Rat
Supplemental Fig. 2 Pathway mapping of complement and coagulation cascade Diagram showing the effect of gene expression on the complement and coagulation cascade following a single or 14-day repeated treatment of TCE in mice (A) and rats (B). Pink and light blue boxes represent up-regulated and down-regulated genes in the single-dose study, respectively, and red and dark blue boxes up-regulated and down-regulated genes in the repeated-dose study, respectively. Gray boxes represent not significantly altered genes by TCE exposure. White boxes represent out of QC genes or not presented genes on the chip. Acute-phase response genes, which include the fibrinogen β chain (Fgb), orosomucoid 2 (Orm2), fibrinogen polypeptide (Fg), and serum amyloid A (Saa), are negatively regulated by PPAR through titration of coactivator GRIP1/TIF2 and interference with the CCAAT/enhancer binding protein (C/EBP) β (Cebpβ) (Gervois et al., 2001). In mice treated with repeated TCE doses, fibrinogen-b, coagulation factor, and Saa2 were down-regulated, whereas in rats treated with repeated TCE doses, Fga and C/EBP were down-regulated and up-regulated, respectively. These results suggest that the coagulation cascade is suppressed in both mice and rats. Kininogen (Kng), a coagulation factor of the intrinsic coagulation pathway, plays an important role in the fibrinolytic system. Results showed that Kng was down-regulated together with factor XII and kallikrein in single-dose mice. Further, kallikrein B plasm1 (klkb1), which participates in fibrinolysis and kinin generation, was down-regulated in repeated-dose rats. Plasmin, which is generated from inactive precursor plasminogen and recruited to fibrin clots, plays a central role in clot dissolution. Plasmin and plasminogen activators are enzymatically inactivated by specific serpins to form inactive complexes (Kohler and Grant, 2000). Our results show a down-regulation of plasminogen and serpinf2 in mice and Serpina1 in rats. These findings show that the gene expression involved in fibrinolytic systems, including that of kininogen and serpin, are down-regulated in mice and rats treated with single or repeated TCE doses. Examination of the complementation cascade in mice shows down-regulation of complement component 1, q subcomponent, beta polypeptide (C1qb), complement component 3 (C3), and complement components 4A and 4B (C4), as well as up-regulation of Cd59, which reduced C9 activity. In rats, analysis showed down-regulation of C1qb, C4 and Sering1. These results are in agreement with previous reports which showed that PPAR agonists hamper immune response, in particular the complementation cascade in rodents and primates (Cariello et al., 2005). References Cariello, N. F., Romach, E. H., Colton, H. M., Ni, H., Yoon, L., Falls, J. G., Casey, W., Creech, D., Anderson, S. P., Benavides, G. R., Hoivik, D. J., Brown, R., and Miller, R. T. (2005). Gene expression profiling of the PPAR-alpha agonist ciprofibrate in the cynomolgus monkey liver. Toxicol Sci88, 250-264. Gervois, P., Vu-Dac, N., Kleemann, R., Kockx, M., Dubois, G., Laine, B., Kosykh, V., Fruchart, J. C., Kooistra, T., and Staels, B. (2001). Negative regulation of human fibrinogen gene expression by peroxisome proliferator-activated receptor alpha agonists via inhibition of CCAAT box/enhancer-binding protein beta. J Biol Chem276, 33471-33477. Kohler, H. P., and Grant, P. J. (2000). Plasminogen-activator inhibitor type 1 and coronary artery disease. N Engl J Med342, 1792-1801.
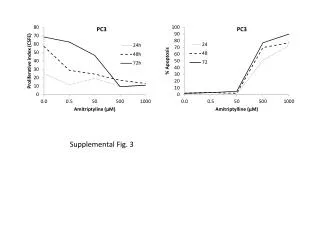
Supplementary Fig. 3 Circadian Exercise A. Mouse B. Rat
Supplemental Fig. 3 Pathway mapping of circadian exercise Diagram showing the effect of gene expression on the circadian exercise cascade following a single or 14-day repeated treatment of TCE in mice (A) and rats (B). Pink and light blue boxes represent up-regulated and down-regulated genes in the single-dose study, respectively, and red and dark blue boxes up-regulated and down-regulated genes in the repeated-dose study, respectively. Gray boxes represent not significantly altered genes by TCE exposure. White boxes represent out of QC genes or not presented genes on the chip. Sets of circadian oscillator genes showed different expression between mice and rats by single TCE dose. Examination of the gene set revealed, for example, a down-regulation of aryl hydrocarbon receptor nuclear translocator-like (Arnt1/Bmal1) in single-dose mice and rats and an up-regulation of cryptochrome 1 (Cry1) and G0/G1 switch gene 2 (G0s2) in single-dose mice but not rats.
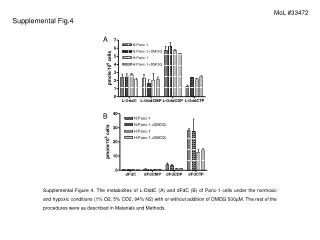
Supplementary Fig. 4 TGF- Signaling pathway A. Mouse B. Rat
Supplemental Fig. 4 Pathway mapping of TGF-β signaling Diagram showing the effect of gene expression on the TGF-β signaling pathway following a single or 14-day repeated treatment of TCE in mice (A) and rats (B). Pink and light blue boxes represent up-regulated and down-regulated genes in the single-dose study, respectively, and red and dark blue boxes up-regulated and down-regulated genes in the repeated-dose study, respectively. Gray boxes represent not significantly altered genes by TCE exposure. White boxes represent out of QC genes or not presented genes on the chip.
Supplementary Fig. 5 MAPK cascade A. Mouse B. Rat
Supplemental Fig. 5 Pathway mapping of MAPK cascade Diagram showing the effect of gene expression on the MAPK cascade following a single or 14-day repeated treatment of TCE in mice (A) and rats (B). Pink and light blue boxes represent up-regulated and down-regulated genes in the single-dose study, respectively, and red and dark blue boxes up-regulated and down-regulated genes in the repeated-dose study, respectively. Gray boxes represent not significantly altered genes by TCE exposure. White boxes represent out of QC genes or not presented genes on the chip. In single-dose mice, results show up-regulation of mitogen-activated protein kinase kinase 2 (Map2k2) and mitogen-activated protein kinase (Mapk1), as well as down-regulation of dual specificity phosphatase 6 (Dusp6), whose gene product inactivates Mapk1 by dephosphorylation. In addition, Nras and Kras were up-regulated in single- and repeated-dose mice, respectively (A). In rats, genes involved in the RAS/MEK/ERK signaling cascade, namely protein phosphatase 3 catalytic subunit, alpha isoform (Ppp3ca) and protein phosphatase 1A magnesium-dependent, alpha isoform (Ppm1a) were altered but likely not affected by activation or inactivation of the pathway (B).
Supplementary Fig. 6 Proteasome degradation pathway A. Mouse B. Rat
Supplemental Fig. 6 Pathway mapping of proteasome pathway Diagram showing the effect of gene expression on the proteasome pathway following a single or 14-day repeated treatment of TCE in mice (A) and rats (B). Pink and light blue boxes represent up-regulated and down-regulated genes in the single-dose study, respectively, and red and dark blue boxes up-regulated and down-regulated genes in the repeated-dose study, respectively. Gray boxes represent not significantly altered genes by TCE exposure. White boxes represent out of QC genes or not presented genes on the chip.