Download
1 / 1
10 likes | 155 Views
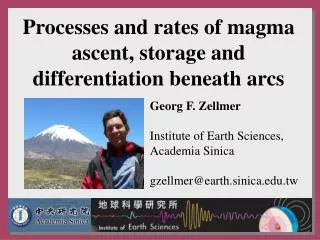
DI53-2375. Imaging Crustal Magma Reservoirs Beneath Sierra Negra and Cerro Azul Volcanoes, Gal a pagos Gabrielle Tepp, Manahloh Belachew, Cynthia Ebinger: U. of Rochester, Kevin Seats: Stanford U., Dustin Cote: U of Rochester, Mario Ruiz: IGEPN, Ecuador, Jesse Lawrence: Stanford U.

E N D
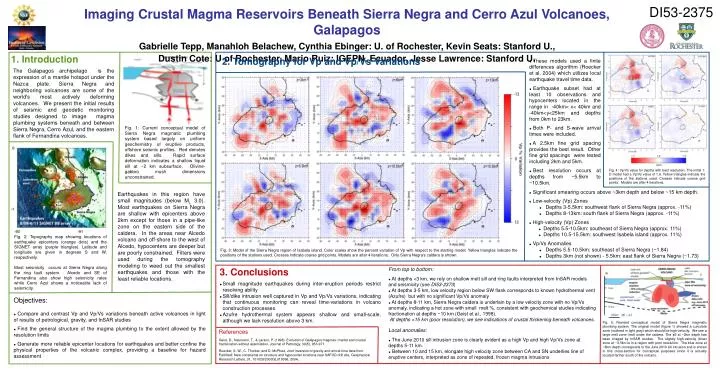
DI53-2375 Imaging Crustal Magma Reservoirs Beneath Sierra Negra and Cerro Azul Volcanoes, Galapagos Gabrielle Tepp, Manahloh Belachew, Cynthia Ebinger: U. of Rochester, Kevin Seats: Stanford U., Dustin Cote: U of Rochester, Mario Ruiz: IGEPN, Ecuador, Jesse Lawrence: Stanford U. 1. Introduction 2. Tomography for Vp and Vp/Vs Variations • These models used a finite differences algorithm (Roecker et al, 2004) which utilizes local earthquake travel time data. • Earthquake subset had at least 10 observations and hypocenters located in the range in -40km< x< 40km and -40km<y<25km and depths from 0km to 23km. • Both P- and S-wave arrival times were included. • A 2.5km fine grid spacing provides the best result. Other fine grid spacings were tested including 2km and 5km. • Best resolution occurs at depths from ~5.5km to ~10.5km. The Galapagos archipelago is the expression of a mantle hotspot under the Nazca plate. Sierra Negra and neighboring volcanoes are some of the world's most actively deforming volcanoes. We present the initial results of seismic and geodetic monitoring studies designed to image magma plumbing systems beneath and between Sierra Negra, Cerro Azul, and the eastern flank of Fernandina volcanoes. Fig. 1: Current conceptual model of Sierra Negra magmatic plumbing system based largely on uniform geochemistry of eruptive products, offshore seismic profiles. Red denotes dikes and sills. Rapid surface deformation indicates a shallow liquid sill at ~2 km subsurface. Olivine-gabbro mush dimensions unconstrained. Fig. 4: Vp/Vs value for depths with best resolution. The initial 1-D model had a Vp/Vs value of 1.8. Yellow triangles indicate the positions of the stations used. Crosses indicate coarse grid points. Models are after 4 iterations. • Significant smearing occurs above ~3km depth and below ~15 km depth. • Low-velocity (Vp) Zones • Depths 3-5.5km: southwest flank of Sierra Negra (approx. -11%) • Depths 8-13km: south flank of Sierra Negra (approx. -11%) • High-velocity (Vp) Zones • Depths 5.5-10.5km: southeast of Sierra Negra (approx. 11%) • Depths 10.5-15.5km: southwest Isabela island (approx. 11%) • Vp/Vs Anomalies • Depths 5.5-10.5km: southeast of Sierra Negra (~1.84) • Depths 3km (not shown) - 5.5km: east flank of Sierra Negra (~1.73) Earthquakes in this region have small magnitudes (below ML 3.0). Most earthquakes on Sierra Negra are shallow with epicenters above 2km except for those in a pipe-like zone on the eastern side of the caldera. In the areas near Alcedo volcano and off-shore to the west of Alcedo, hypocenters are deeper but are poorly constrained. Filters were used during the tomography modeling to weed out the smallest earthquakes and those with the least reliable locations. Fig. 2: Topography map showing locations of earthquake epicenters (orange dots) and the SIGNET array (purple triangles). Latitude and longitude are given in degrees S and W, respectively. Most seismicity occurs at Sierra Negra along the ring fault system. Alcedo and SE of Fernandina also show high seismicity rates while Cerro Azul shows a noticeable lack of seismicity. Fig. 3: Model of the Sierra Negra region of Isabela island. Color scales show the percent variation of Vp with respect to the starting model. Yellow triangles indicate the positions of the stations used. Crosses indicate coarse grid points. Models are after 4 iterations. Only Sierra Negra's caldera is shown. 3. Conclusions • Small magnitude earthquakes during inter-eruption periods restrict resolving ability • Sill/dike intrusion well captured in Vp and Vp/Vs variations, indicating that continuous monitoring can reveal time-variations in volcano construction processes • Azufre hydrothermal system appears shallow and small-scale, although we lack resolution above 3 km. From top to bottom: • At depths <3 km, we rely on shallow melt sill and ring faults interpreted from InSAR models and seismicity (see DI53-2373) • At depths 3-5 km, low velocity region below SW flank corresponds to known hydrothermal vent (Azufre) but with no significant Vp/Vs anomaly • At depths 8-11 km, Sierra Negra caldera is underlain by a low velocity zone with no Vp/Vs anomaly, indicating a hot zone with small melt %, consistent with geochemical studies indicating fractionation at depths ~10 km (Geist et al., 1998). At depths >15 km (poor resolution), we see indications of crustal thickening beneath volcanoes. Objectives: • Compare and contrast Vp and Vp/Vs variations beneath active volcanoes in light of results of petrological, gravity, and InSAR studies • Find the general structure of the magma plumbing to the extent allowed by the resolution limits • Generate more reliable epicenter locations for earthquakes and better confine the physical properties of the volcanic complex, providing a baseline for hazard assessment Fig. 5: Revised conceptual model of Sierra Negra magmatic plumbing system. The original model (figure 1) showed a cumulate zone (outlined in light gray) which should be high-velocity. We see a large melt zone (red) under the caldera. The sill at ~2km depth has been imaged by InSAR studies. The slightly high-velocity (blue) zone at ~3-5km is in a region with poor resolution. The blue zone at ~8km depth corresponds to the June 2010 sill intrusion and is shown in this cross-section for conceptual purposes since it is actually located farther south of the volcano. Local anomalies: • The June 2010 sill intrusion zone is clearly evident as a high Vp and high Vp/Vs zone at depths 5-11 km. • Between 10 and 15 km, elongate high velocity zone between CA and SN underlies line of eruptive centers, interpreted as zone of repeated, frozen magma intrusions References Geist, D., Naumann, T., & Larson, P. (1998). Evolution of Galápagos magmas: mantle and crustal fractionation without assimilation. Journal of Petrology, 39(5), 953-971. Roecker, S. W., C. Thurber, and D. McPhee, Joint inversion of gravity and arrival time data from Parkfield: New constraints on structure and hypocenter locations near SAFOD drill site, Geophysical Research Letters, 31, 101029/2003GL019396, 2004.