Download
1 / 8
90 likes | 180 Views
AP Review #1. Focus: Least Squares Regression Non-Linear Regression Least-Squares Regression is the line of best fit where the sum of the squares of the residuals is as small as possible. LSRL’s. If data is fairly linear then the LSRL is:.

E N D
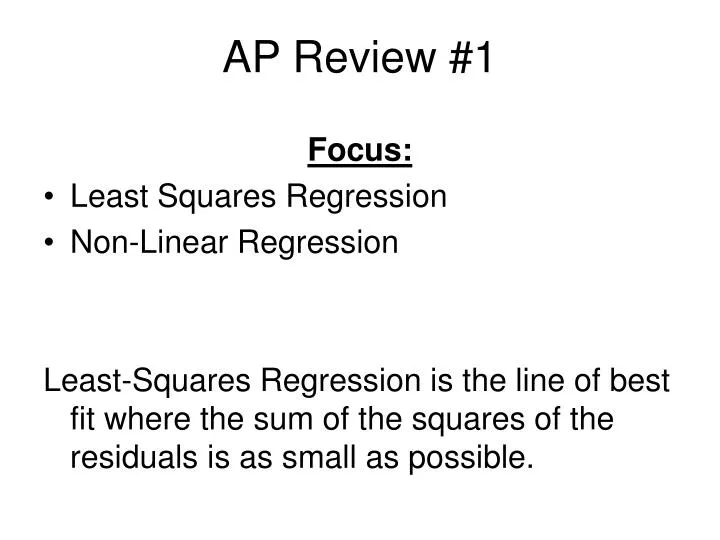
AP Review #1 Focus: • Least Squares Regression • Non-Linear Regression Least-Squares Regression is the line of best fit where the sum of the squares of the residuals is as small as possible.
LSRL’s If data is fairly linear then the LSRL is: r = correlation = the strength and direction of the linear relationship -1 r 1 : the closer it is to 1 or -1, the stronger the linear relationship r² = coefficient of determination = the percent of the change in y that is predicted by LSRL
More about LSRL’s Residual plots are useful to see if Least-Squares Regression is applicable. If there is a pattern in the residual plot, then Least-Squares Regression is not appropriate. The sum of all residuals = 0 (except for rounding error!)
Non-Linear Regression Use logs or another transformation (square roots, etc.) to make the data straight enough to do regression. Usually, we log the y’s to straighten data (this is if the data is exponential), but we can log both x’s and y’s (this called power regression). If use a transformation to straighten the data, then we will need to undo the transformation to get our equation.
Example #2 In State College, Penn State puts on an annual dance marathon, which has been contributing funds to the 4 Diamonds Fund since 1977. It is amazing how much has been raised the the students. Here are some data over these years from 1977 to 2008. Find a model for the data and predict what the students will raise in 2010.
Example #2 • Look at the scatterplot. Try finding the LSRL. Look at the residual plot. • Try logging the y’s and finding an equation. • Try logging both the x’s and y’s and finding an equation. • What is your estimate for 2010?
Y = -142294752,88 + 172417.8213x r = .916 and r² = .839 residual plot is very curved, not appropriate. • Log y’s – much straighter scatterplot. Residual is still curved. • Log both x’s and y’s – even straighter scatterplot Best Residual. Power is the best model!