Download
1 / 30
310 likes | 546 Views
Winter Ozone Formation Sensitivity to Surface Albedo, Heterogeneous Chemistry and Precursor Emissions. Gail Tonnesen, Kirk Baker, Golam Sarwar, U.S. Environmental Protection Agency Bernhard Rappenglueck, Department of Earth and Atmospheric Sciences, University of Houston.

E N D
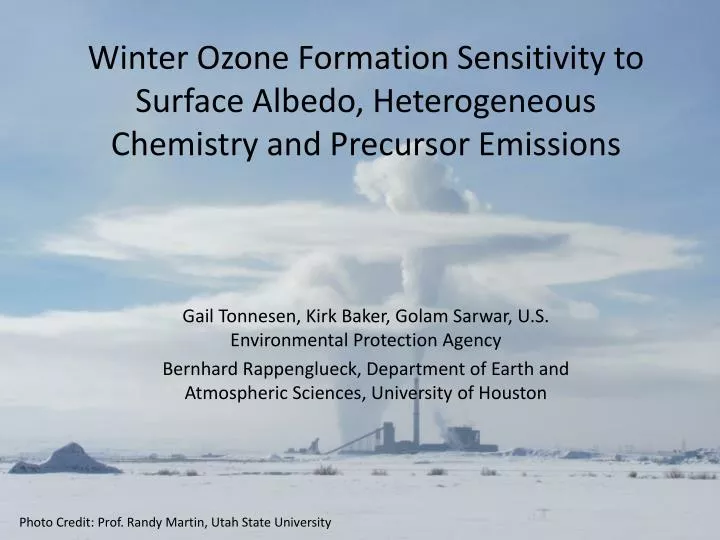
Winter Ozone Formation Sensitivity to Surface Albedo, Heterogeneous Chemistry and Precursor Emissions Gail Tonnesen, Kirk Baker, Golam Sarwar, U.S. Environmental Protection Agency Bernhard Rappenglueck, Department of Earth and Atmospheric Sciences, University of Houston Photo Credit: Prof. Randy Martin, Utah State University
Winter Ozone Episodes • Observed in some oil and gas productions areas in WY, UT, CO. • Only occurs with snow cover: • Snow strengthens the inversion. • Snow enhances surface albedo and nearly doubles the rates of photolysis reactions. • Snow photochemistry might also act as a source of precursors and radicals. • Terrain features trapping air, and conducive meteorology (cold pools) also critically important. • Precursor emissions and high VOC/NOx ratio. Plot from Russ Schnell, NOAA GMD, for 2009-2010 ozone data in the Uintah Basin.
WY and UT Winter Ozone Basins Figure 1-1 from Page 16, EDL 2011Report
Locations of O&G emissions sources Figure 2-2 from Page 22, EDL 2011Report
Uintah Basin Winter Ozone Study 2011 • Elevated ozone first observed at 4 monitors in 2010. • Distributed ozone monitoring study in 2011 measures elevated ozone across the basin, Utah State Univ. • Several multiday inversion episodes with increasing nighttime lows and daytime highs.
Uintah Basin Winter Ozone Study 2012 • UBOS 2012: first intensive research study. No snow and no ozone, but rich data set for precursors and methane. NOAA, Universities, Utah DEQ, BLM, EPA, WEA. Photo: Brian Lerner, NOAA, 2012, Horsepool research site.
Uintah Basin Winter Ozone Study 2013 • UBOS 2013: seven multiday inversion episodes varying from 3 to 17 days long. • Max 8-hour average ozone was 152 ppb. • Exceeded the NAAQS on a total of 22 days at Vernal and 29 days at Roosevelt Photo: Jim Roberts, NOAA, 2013 UBOS, Horsepool research site.
Winter high daytime HONO • Rappenglueck et al used LOPAP to measure high daytime HONO in WY in 2010 & 2011. • Typical daytime HONO levels observed in 2012 UBOS, DOAS, acid-CIMS • NOAA observed high daytime HONO in 2013 UBOS, acid-CIMS and Cavity-enhanced Absorption Spectrometer, however, • concerns remain in possible interference from HO2NO2. • Planning a UBOS 2014 study to focus on radical budgets, including HONO and HCHO. (DOAS, LOPAP, acid-CIMS, ACES)
2010-2011 Winter CMAQ Modeling • Use WRF and CMAQ version 5.01 model sensitivity studies to test uncertainty in key processes that affect: • winter ozone in Uintah Basin (Utah/Colorado) • winter ozone in Upper Green River Basin (Wyoming) • winter PM2.5 in Salt Lake City, UT (not the focus of this talk) • Key uncertainties include: • Effects of snow cover on albedo and photolysis rates • Effects of heterogeneous chemistry in snow on radicals • Uncertainty in emissions inventories
Model Inputs METEOROLOGY • WRF v3.3 • MYJ PBL, NOAH land surface model, Janjic Eta surface layer scheme • Thompson microphysics, Grell 3D cumulus • RRTM longwave, Goddard shortwave • USGS landuse data • Input analysis data from NARR • No nudging • MCIP v4.0 EMISSIONS • Anthropogenic 2011 NEI v2 based platform • WRAP phase III oil & gas emissions Initial and Boundary conditions • 2010/2011 GEOS-CHEM simulation downscaled with CMAQ to 36 km
CMAQ Ozone Base Case Base case max O3: 49 ppb; bias -120 ppb
Winter Ozone Sensitivity Tests • Albedo sensitivity using snow cover to enhance surface albedo, which increases photolysis: • CMAQ base case uses seasonal snow coefficients to modify surface albedo • As a sensitivity, changed surface albedo to match snow cover • HONO sensitivity – add HONO source in layer 1 proportional to HNO3 concentration and HNO3 photolysis rate. • VOC emissions from oil & gas sources are increased to determine impact on modeled ozone.
Modeled Snow Cover Feb 14, 2011 SNODAS Modeled Depth WRF-CMAQ fractional snow cover
Snow Cover Effect on Photorates CMAQ NO2 Photorate WRF-CMAQ fractional snow cover Plots from Photorate diagnostic output file
Albedo & Photolysis Rate Model Sensitivity CMAQ 5.01 with seasonal snow coefficients, small increases in JNO2 CMAQ sensitivity with increased snow albedo, larger increase in JNO2 Albedo set to 90% of fractional snow cover (right plot)
CMAQ Ozone effect of Snow albedoFeb 14, 2011 Base case with default albedo CMAQ sensitivity with increased albedo Albedo case max O3: 72 ppb Base case max O3: 49 pbb
CMAQ delta Ozone effect of Snow albedo O3 increased up to 34 ppb, largest increases in Uintah Basin
CMAQ Ozone effect of HONO source Increased Snow Albedo HONO from HNO3 sensitivity HONO case max O3: 92 ppb Albedo case max O3: 72 ppb
CMAQ delta Ozone effect of HONO source Largest increases, 29 ppb, in Uintah Basin, small effect in WY
VOC Emissions Sensitivity • Very large negative model bias for VOC in the Upper Green basin and large negative bias for VOC in the Uintah Basin. • CMAQ modelsensitivity simulations with: • 2x VOC emissions in UB and 5x VOC emissions in UGB • 5x VOC emissions in UB and 10x VOC emissions in UGB
Conclusions • CMAQ can simulate elevated winter ozone in the Uintah and Upper Green River basins if adjustments are made to snow cover, albedo, emissions, and radical sources: • However, uncertainty remains in the correct setting for each of these parameters. • CMAQ inline albedo and photolysis approach has been revised to represent snow albedo adjustment for landuse types in the Uintah Basin. • Landuse type adjustments may need additional refinement. • Emissions, particularly VOC, need further examination. • Model ozone is highly sensitive to addition of a daytime surface radical (HONO) source. • additional measurement studies are needed to confirm and understand the cause of high daytime HONO. • UBOS 2014 study will measure radicals sources.