Download

1 / 21
210 likes | 355 Views
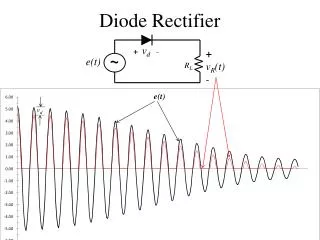
EE462L, Fall 2011 Diode Bridge Rectifier (DBR). Diode Bridge Rectifier (DBR). Be extra careful that you observe the polarity markings on the electrolytic capacitor.

E N D
Diode Bridge Rectifier(DBR) Be extra careful that you observe the polarity markings on the electrolytic capacitor Important − never connect a DBR directly to 120Vac or directly to a variac. Use a 120/25V transformer. Otherwise, you may overvoltage the electrolytic capacitor Equivalent DC load resistance RL Idc + 1 3 Iac + ≈ 28√2Vdc≈ 40Vdc − 120/25V Transformer 120V Variac + ≈ 28Vac rms – 4 2 –
Variac, Transformer, DBR Hookup The variac is a one-winding transformer, with a variable output tap. The output voltage reference is the same as the input voltage reference (i.e., the output voltage is not isolated). The 120/25V transformer has separate input and output windings, so the input voltage reference is not passed through to the output (i.e., the output voltage is isolated)
Example of Assumed State Analysis RL + – + Vac – • Consider the Vac > 0 case • We make an intelligent guess that I is flowing out of the source + node. • If current is flowing, then the diode must be “on” • We see that KVL (Vac =I • RL ) is satisfied • Thus, our assumed state is correct
Example of Assumed State Analysis + 11V – Auctioneering circuit + 11V – + 10V – − 1V + RL • We make an intelligent guess that I is flowing out of the 11V source • If current is flowing, then the top diode must be “on” • Current cannot flow backward through the bottom diode, so it must be “off” • The bottom node of the load resistor is connected to the source reference, so there is a current path back to the 11V source • KVL dictates that the load resistor has 11V across it • The bottom diode is reverse biased, and thus confirmed to be “off” • Thus our assumed state is correct
Assumed State Analysis + 1 3 What are the states of the diodes – on or off? RL + Vac – 4 2 – • Consider the Vac > 0 case • We make an intelligent guess that I is flowing out of the source + node. • I cannot flow into diode #4, so diode #4 must be “off.” If current is flowing, then diode #1 must be “on.” • I cannot flow into diode #3, so diode #3 must be “off.” I flows through RL. • I comes to the junction of diodes #2 and #4. We have already determined that diode #4 is “off.” If current is flowing, then diode #2 must be “on,” and I continues to the –Vac terminal.
+ + + − − − Assumed State Analysis, cont. 1 RL + Vac> 0 – 2 • A check of voltages confirms that diode #4 is indeed reverse biased as we have assumed • A check of voltages confirms that diode #3 is indeed reverse biased as we have assumed • We see that KVL (Vac =I • RL ) is satisfied • Thus, our assumed states are correct • The same process can be repeated for Vac < 0, where it can be seen that diodes #3 and #4 are “on,” and diodes #1 and #2 are “off”
3 1 + + V V dc dc – + – – 4 2 V < 0 V > 0 ac ac + – Vac Vdc 40 40 20 Volts 20 0 0.00 8.33 16.67 25.00 33.33 Volts 0 -20 0.00 8.33 16.67 25.00 33.33 -20 -40 Milliseconds -40 Milliseconds AC and DC Waveforms for a Resistive Load With a resistive load, the ac and dc current waveforms have the same waveshapes as Vac and Vdc shown above Note – DC does not mean constant!
F - Hz C - uF VAC P - W 60 18000 28 200 C charges C discharges to load 45 Peak - to - peak 40 ripple voltage 35 30 25 Vsource Volts Vcap 20 15 10 5 0 0.00 2.78 5.56 8.33 11.11 13.89 16.67 Milliseconds EE362L_Diode_Bridge_Rectifier.xls Diode bridge conducting. AC system replenishing capacitor energy. Diode bridge off. Capacitor discharging into load. From the power grid point of view, this load is not a “good citizen.” It draws power in big gulps.
Vdc 1 = T f 200W Load 800W Load Ripple voltage increases Average current increases (current pulse gets taller and wider) Idc DC-Side Voltage and Current for Two Different Load Levels
Approximate Formula for DC Ripple Voltage Energy consumed by constant load power P during the same time interval Energy given up by capacitor as its voltage drops from Vpeak to Vmin
T/2 Δt For low ripple, and Approximate Formula for DC Ripple Voltage, cont.
1 = T f AC Current Waveform
Space left between hex nut and body of switch Mounting the Toggle Switch
For our thermistor, 1pu = 1kΩ Thermistor Characteristics
Measuring the temperature on the backside of a solar panel Rtherm • Thermistor in series with 470Ω resistor • Series combination energized by 2.5Vdc • The voltage across the 470Ω resistor then changes with temperature as shown below 2.5V To data logger 470Ω Excel curve fit. Coefficients entered into data logger. As the thermistor gets hotter, more of the 2.5V appears across the 470Ω resistor
Scope alligator clip Scope probe 3 1 4 2 Esti mate on oscilloscope the average value I of avg ac current over conduction interval T cond Estimate on oscilloscope the average value V avg of diode forward voltage drop over conduction interval T cond Since the forward voltage on the diode is approximately constant during the conduction interval, the energy absorbed by the diode during the conduction interval is approximately V • I • T . Each diode has one conduction interval per avg avg cond 4 V I T avg avg cond = = P 240 V I T 60Hz period, so the average power absorbed by all four diodes is then avg avg avg cond T 60 Hz Watts. Measuring Diode Losses with an Oscilloscope i(t) v(t) T cond
Conducting Zero Zoom-In Zero Forward Voltage on One Diode Forward voltage on one diode Forward voltage on one diode
One pulse like this passes through each diode, once per cycle of 60Hz AC Current Waveform View this by connecting the oscilloscope probe directly across the barrel of the 0.01Ω current-sensing resistor The shape is nearly triangular, so the average value is approximately one-half the peak