Download
1 / 30
300 likes | 429 Views
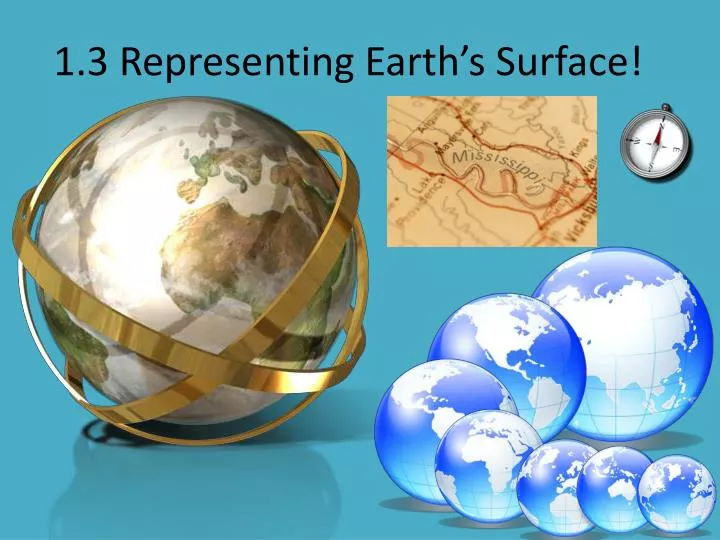
1.3 Representing Earth’s Surface!. Map History. Maps made by travelers/explorers enabled people (with access) to learn and understand their world more. Early maps? (12,500BC and earlier) Maps of the heavens! Constellations, bright lights, etc., on cave walls, or otherwise carved in stone

E N D
Map History • Maps made by travelers/explorers enabled people (with access) to learn and understand their world more. • Early maps? (12,500BC and earlier) • Maps of the heavens! Constellations, bright lights, etc., on cave walls, or otherwise carved in stone • Game trails, guide to resources, territory… • Later maps focused on trade routes, new territory, expansion, etc.
Babylonian World Map • Earliest surviving “world” map ~600 BC • Likely more of a spiritual/mythological interpretation
Turin Papyrus Map – Ancient Egypt ~1160BC • Early example of accurate surveying and topography.
PomponiusMela ~43AD World View • Roman Geographer
Map History • Eventually images taken from airplanes and later satellite images finally revealed the surface of Earth in great detail…the mystery and romance was officially dead • A complete view of Earth did kill the classic image of exploration; but also lead to new forms! (deepest places, outer space)
Global Grid • Latitude • Longitude • Equator • Prime Meridian
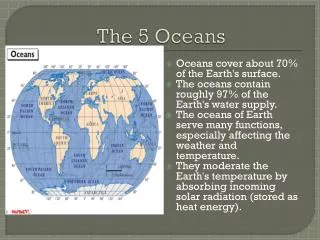
Globes! • Best representation of Earth, because… • Must make a HUGE globe to represent anything smaller than continents/countries • Your street address would not be able to be shown on a normal sized globe • So, we must use 2D maps to represent the Earth’s surface. In this way, we can “zoom” in • But there is a problem…
2D Maps • No matter the map, some portion of Earth’s surface will be distorted or out of place. • So map makers, cartographers, have developed various projections to emphasize features/information while limiting distortion.
Types of Maps • Mercator – direction accurate, but lots of distortion with sizes/distances • Robinson – generally accurate, with little distortion except for around the edges • Conic – oddly shaped map, little distortion, road maps • Gnomonic Projection – circular shaped, distortion with size, distance, direction – show shortest distance between two points
Map Types • http://youtu.be/AI36MWAH54s • http://youtu.be/dldHalRY-hY
Topographic Maps • Maps that communicate elevation and surface features using contour lines. • Bodies of water • Roads • Government/public buildings • Political boundaries • Place names • Contour lines connect and show points of similar elevation – meaning each location on a single contour line is the same elevation • Index contour – A bold contour line with elevation printed on it, every 5th line (usually) • Contour Interval – difference between elevation between adjacent lines – very important to establish. On most USGS maps = 20ft
Topographic Maps • The slope, grade, or steepness is represented by the spacing of the contour lines • closer spaced lines = steeper gradient or slope of terrain, while farther spaced lines represent flatter terrain • Many symbols, so a good key is important • These maps can be very “busy” and complicated, but are very useful for geologists, hikers, “geocashers”, campers, and anyone else interested in the 3D layout of the land.
Topographic Maps • Depressions are represented by special contour line circles indicated by hachure marks (small inward facing tick marks) • Contour lines bend across rivers/streams and “point” upstream. For example, if contour lines are “pointing” North as they cross a river, the river is flowing south. • Hills/mountain peaks are represented by concentric or nested circles
Topographic Maps • The highest or lowest possible elevation for a point not marked with a spot or benchmark elevation is always just before whatever the next contour line would have marked. See examples on note sheets and videos on wikispace. • Spot elevations are marked with and ‘X’ and the elevation • Benchmarks are marked with a “BM” and an ‘X’ with the elevation (these are officially confirmed elevations with a metal USGS {United States Geological Survey} plaque in the ground)