Download
1 / 1
10 likes | 62 Views

E N D
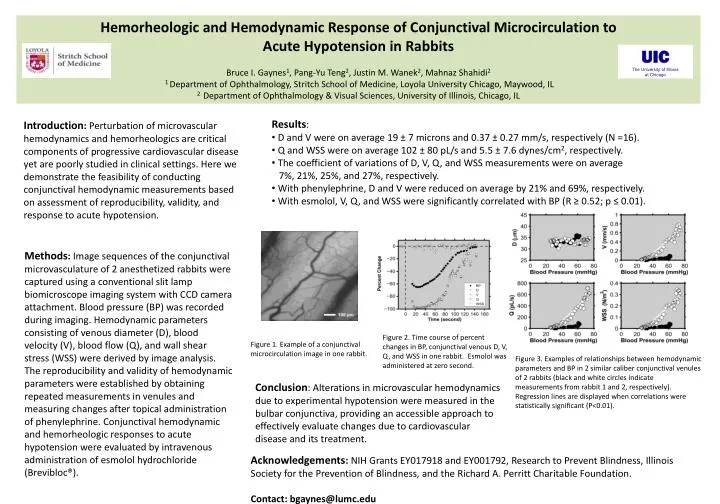
Hemorheologic and Hemodynamic Response of Conjunctival Microcirculation to Acute Hypotension in Rabbits Bruce I. Gaynes1, Pang-Yu Teng2, Justin M. Wanek2, Mahnaz Shahidi21 Department of Ophthalmology, Stritch School of Medicine, Loyola University Chicago, Maywood, IL 2 Department of Ophthalmology & Visual Sciences, University of Illinois, Chicago, IL UIC The University of Illinoisat Chicago • Results: • D and V were on average 19 ± 7 microns and 0.37 ± 0.27 mm/s, respectively (N =16). • Q and WSS were on average 102 ± 80 pL/s and 5.5 ± 7.6 dynes/cm2, respectively. • The coefficient of variations of D, V, Q, and WSS measurements were on average 7%, 21%, 25%, and 27%, respectively. • With phenylephrine, D and V were reduced on average by 21% and 69%, respectively. • With esmolol, V, Q, and WSS were significantly correlated with BP (R ≥ 0.52; p ≤ 0.01). Introduction: Perturbation of microvascular hemodynamics and hemorheologics are critical components of progressive cardiovascular disease yet are poorly studied in clinical settings. Here we demonstrate the feasibility of conducting conjunctivalhemodynamic measurements based on assessment of reproducibility, validity, and response to acute hypotension. Methods: Image sequences of the conjunctival microvasculature of 2 anesthetized rabbits were captured using a conventional slit lamp biomicroscope imaging system with CCD camera attachment. Blood pressure (BP) was recorded during imaging. Hemodynamic parameters consisting of venous diameter (D), blood velocity (V), blood flow (Q), and wall shear stress (WSS) were derived by image analysis. The reproducibility and validity of hemodynamic parameters were established by obtaining repeated measurements in venules and measuring changes after topical administration of phenylephrine. Conjunctival hemodynamic and hemorheologic responses to acute hypotension were evaluated by intravenous administration of esmolol hydrochloride (Brevibloc®). Figure 2. Time course of percent changes in BP, conjunctival venous D, V, Q, and WSS in one rabbit. Esmolol was administered at zero second. Figure 1. Example of a conjunctival microcirculation image in one rabbit. Figure 3. Examples of relationships between hemodynamic parameters and BP in 2 similar caliber conjunctival venules of 2 rabbits (black and white circles indicate measurements from rabbit 1 and 2, respectively). Regression lines are displayed when correlations were statistically significant (P<0.01). Conclusion: Alterations in microvascular hemodynamics due to experimental hypotension were measured in the bulbar conjunctiva, providing an accessible approach to effectively evaluate changes due to cardiovascular disease and its treatment. Acknowledgements: NIH Grants EY017918 and EY001792, Research to Prevent Blindness, Illinois Society for the Prevention of Blindness, and the Richard A. Perritt Charitable Foundation. Contact: bgaynes@lumc.edu