Download
1 / 16
160 likes | 273 Views
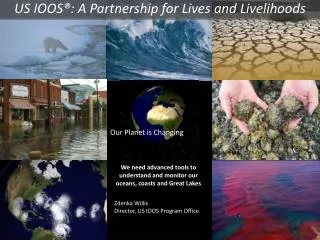
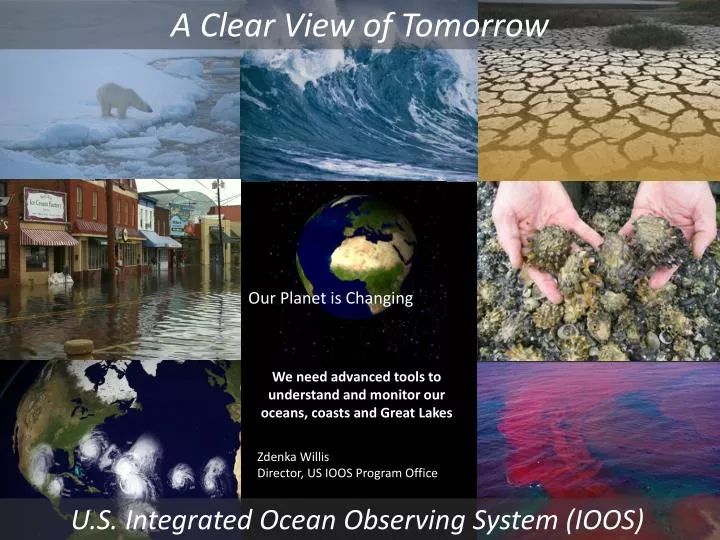
A Clear View of Tomorrow. Our Planet is Changing. We need advanced tools to understand and monitor our oceans, coasts and Great Lakes . Zdenka Willis Director, US IOOS Program Office. U.S. Integrated Ocean Observing System (IOOS). 7 Goals, 1 System

E N D
A Clear View of Tomorrow Our Planet is Changing We need advanced tools tounderstand and monitor our oceans, coasts and Great Lakes Zdenka Willis Director, US IOOS Program Office U.S. Integrated Ocean Observing System (IOOS)
7 Goals, 1 System • Improve predictions of climate changeand weather • Improve the safety and efficiency of maritime operations • Improve forecasts of natural hazards • Improve homeland security • Minimize public health risks • Protect and restore healthy coastal ecosystems • Sustain living marine resources A Clear View of Tomorrow A partnership of federal and non-federal organizations, including industry, academia, state, local and tribal governments Regional Observation Network Physical, chemical, geological and biological measurements improve safety, the economy and the environment U.S. Integrated Ocean Observing System (IOOS)
National Observation Networks: High Frequency Radar • Stakeholders • > 30 institutions operate HF Radars • Used by >40 government/private entities • Partnership with Industry: US-based CODAR Ocean Sensor • Who Depends on it • USCG Search and Rescue: Oil spill response • Water quality; Criminal forensics • Commercial marine navigation • Offshore energy; Harmful algal blooms • Marine fisheries • Emerging - Maritime Domain Awareness • Emerging – Tsunami Decreases search area by 66% in 96 hours
National Observation Networks: Waves • Nation’s wave data now accessible • 181 platforms in 2008; 227 2011 • Wave Plan called for 296 • New IOOS supported wave sites being deployed collaboratively with USACE/ CDIP program • Some platforms need to be upgraded to directional wave measurements
Data Integration - Community NANOOS is a community of people that provides data through one place for quicker decision-making. The value of NANOOS 1 • Washington Dept of Ecology • Oceanic Remote Chemical-optical Analyzer (ORCA) • USGS • University of Washington – Applied Physics Lab • NOAA National Data Buoy Center • King County • NOAA National Ocean Service • IntelliCheckMobilisa • Hood Canal Dissolved Oxygen Program 2 3 2 4 8 9 5 6 7 1 6 2 6 6 2 6 7 3 3 4 7 1 3
Data Integration – Regional to National U.S. National Data Buoy Center
Biological Data Efforts • Biology Data Project • National Tagging and Telemetry meeting • Acoustic Data Management • Smithsonian Institution MarineGOE
International buoy program Tsunami wave at DART Station 21418 located 470n mi northeast of Tokyo. Largest peak 1.8M Responding to Crisis: Japan Tsunami Warning Graphic courtesy NOAA / PMEL / Center for Tsunami Research
Responding to Crisis: Japan Tsunami Response • CeNCOOS: • Recorded the tsunami passage with U.S. IOOS sensors • Five-fold increase in web traffic • NANOOS: • Featured “Tsunami Evacuation Zones for the Oregon Coast” application • NANOOS Visualization System provided easy access to current and water height data • Four-fold increase in web traffic • PacIOOS: • Provided the only real-time water level and turbidity measurements for Waikiki • Ten-fold increase in web traffic
Using Social Media to reach out in new ways Types of Information: Initial info including link to tsunami portal; graphs of water level for various locations; synthesis information Facebook: = Posts = Tsunami event www.facebook.com/NANOOS.PNW
Responding to Crisis: Hurricane Irene • CaRa: • 4 buoys provided real-time observations • SECOORA: • Buoys used to initialized models/verified forecasts. • Forecast system used by Coast Guard, North Carolina Division of Emergency Management, National Hurricane Center, USACE, and multiple National Weather Service Forecast Offices • MARACOOS: • Surface currents by the High Frequency Radar • Delivered forecasts to New Jersey Board of Public Utilities , Connecticut governors office and Delaware River Basin Commission • Underwater glider collected data • NERACOOS: • Buoys critical to the National Weather Service • Local television stations in Connecticut reported conditions from the NERACOOS buoy • Northeast Coastal Ocean Forecast System (NeCOFS) provided to the National Weather Service Around-the-clock data and other information before, during and after hurricanes
US IOOS Modeling Testbed Inundation Shelf Hypoxia Gulf of Maine / Scituate Harbor Estuary Hypoxia Cyber Toolbox
U.S. IOOS: Education • Promote Regional Activity
U.S. IOOS® : A National Endeavor but in a Global Context • Comprehensive system • Data Integration critical • Sustaining the enterprise requires engagement by all