Download
1 / 2
20 likes | 126 Views
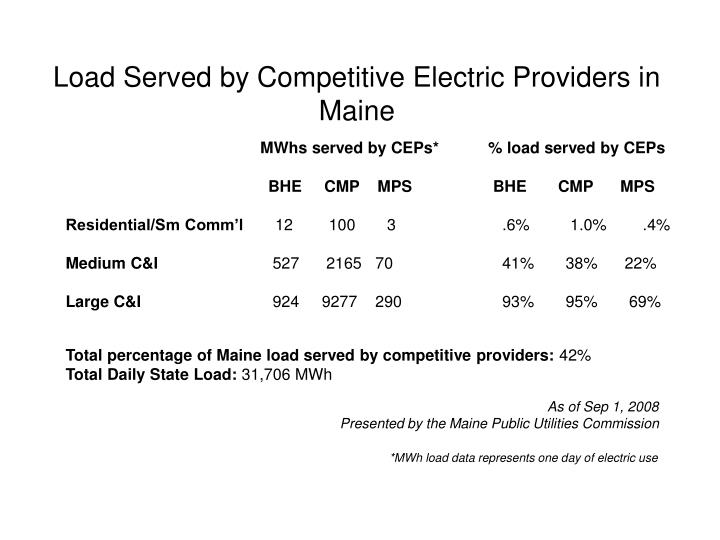
MWhs served by CEPs* % load served by CEPs BHE CMP MPS BHE CMP MPS Residential/Sm Comm’l 12 100 3 .6% 1.0% .4%

E N D
MWhs served by CEPs* % load served by CEPs BHE CMP MPS BHE CMP MPS Residential/Sm Comm’l 12 100 3 .6% 1.0% .4% Medium C&I 527 2165 70 41% 38% 22% Large C&I 924 9277 290 93% 95% 69% Total percentage of Maine load served by competitive providers: 42% Total Daily State Load: 31,706 MWh As of Sep 1, 2008 Presented by the Maine Public Utilities Commission *MWh load data represents one day of electric use Load Served by Competitive Electric Providers in Maine
Customers served by Competitive Electric Providers in Maine Number of customers served by CEPs % of customers served by CEPs BHE CMP MPS BHE CMP MPS Residential/Sm. Comm’l 487 2,325 122 .4% .4% .3% Medium C&I 390 2,656 33 23% 23% 16% Large C&I 28 305 10 65% 76% 56% Total percentage of customers served by competitive providers: 0.8% Total number of customers served by competitive providers: 6,356 Total number of customers in Maine: 758,805 As of July 1, 2008 Presented by the Maine Public Utilities Commission