Download
1 / 15
190 likes | 492 Views
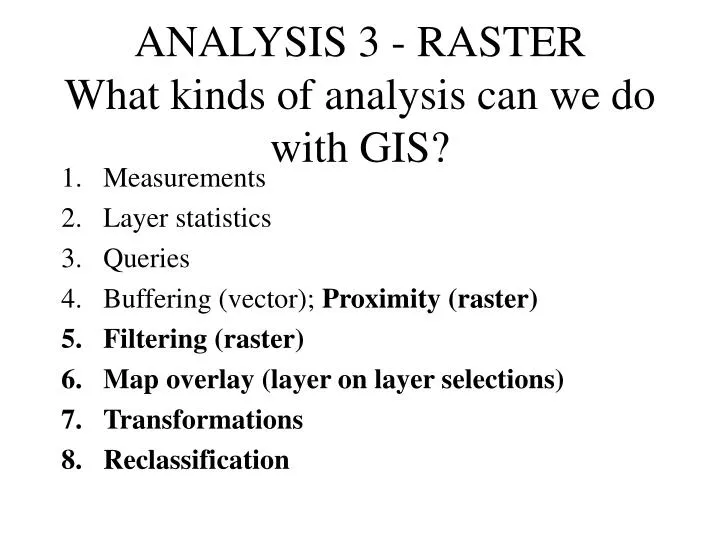
ANALYSIS 3 - RASTER What kinds of analysis can we do with GIS?. Measurements Layer statistics Queries Buffering (vector); Proximity (raster) Filtering (raster) Map overlay (layer on layer selections) Transformations Reclassification. What kinds of analysis can we do with GIS?.

E N D
ANALYSIS 3 - RASTERWhat kinds of analysis can we do with GIS? • Measurements • Layer statistics • Queries • Buffering (vector); Proximity (raster) • Filtering (raster) • Map overlay (layer on layer selections) • Transformations • Reclassification
What kinds of analysis can we do with GIS? • Network analysis • Spatial interpolation • Grid (raster) analysis • Surface analysis • Analytic modeling (Appendix)
Proximity map for hotels in Happy Valley: (a) distance surface; (b) 125 m buffer zones 4b. Proximity - Raster • Concentric equidistant zones established around a starting point • Uses one raster layer, result is another raster layer where the attribute • of each cell is a measure of distance. • In ArcMap – Spatial Analyst extension, distance, allocation(ArcMap refers to this as “straight line allocation”)
Raster GIS filter operations 5. Filtering (raster) • Value of a cell are changed based on attribute values of other cells • Example: recalculating a valuefor cell c4 • Different approaches:min value, max, mean, modal • Often used to “smooth” noisy data (e.g., seams between two digital elevation models)- WE WILL DO THIS TODAY • For seams, in ArcMap, Spatial Analyst, Raster calculator, “mosaic”
6e. Raster Overlay • “Map Algebra” or “Mapematics” (p. 268 Bolstad) • Chapter 10 of Bolstad • Two raster layers with same cell size • Can add, subtract, multiply, divide them to produce a new layer • In ArcMap: Spatial Analyst extension, “Raster Calculator” • We will do this today
Raster overlays: (a) point-in-polygon (using add); (b) line-in-polygon (using add); (c) polygon-on-polygon (using add)
Raster overlays: (d) polygon-on-polygon (Boolean alternatives)
7. Transformations • Raster to vector conversion • In ArcMap, 3-D analyst extension, convert, raster to feature • Vector to raster conversion • In ArcMap, 3-D analyst extension • Raster to Triangular Irregular Network (TIN) • In ArcGIS, 3-D analyst extension • Resampling a raster grid – convert one cell size to another cell size – shown on page 172 of coursepack
8. Reclassification • Converting attribute table field values to some new field and values (p. 236 Bolstad) • Example: Converting a landuse layer with 21 different landuse categories to a layer that is just “forest (1) or no forest (0).” Polygons with value of 10 (forest) should get a value of 1 (yes); otherwise 0 (no). • Example: Satellite image classification • Can be done in vector or raster • In ArcMap: • “Reclassification” in ArcMap help refers to raster… • Vector – Open table, edit, field calculator • Raster – either in Spatial analyst, reclassify (or using raster calculator) or in 3-D analyst
11a. Grid Analysis – Local Functions • Calculate output grid values based on the values from multiple grids at the same location (map calculator) • Local statistics on two or more grid themes • Majority, maximum, mean, median, minimum, sum, etc. • In ArcMap, spatial analyst, cell statistics
11b. Grid Analysis – Neighborhood Functions • Can also calculate statistics on cells that are found within a neighborhood. Neighborhood shapes: • Rectangle • Circle • Doughnut • Wedge • Irregular • Statistics produced: • Majority, maximum, mean, median, minimum, sum, etc. • In ArcMap, spatial analyst, neighborhood statistics
12. Surface Analysis(Ch. 11 Bolstad) • Contour • Slope • Aspect • Hillshade • Visibility analysis… (“Viewshed” in ArcMap) • Good table on p. 290 Bolstad on commonly usedterrain variables and their importance. • In ArcMap, Spatial Analyst extension, “Surface analysis” - TODAY; Also in 3-D analyst.
Ray tracing for visibility analysis Visibility Analysis In ArcMap: 3-D Analyst, surface analysis, viewshed
Some ways to get data into Raster format • They are already in a raster format (e.g., Internet files) • DEMs • Orthophotos • Landsat images • ESRI “Grid” format • You convert vector data to raster in Spatial Analyst extension • Creates a Grid • You create a new raster in a raster software • ERDAS Imagine; Idrissi; ENVI; ER Mapper; Multispec, others…