Download
1 / 27
270 likes | 372 Views
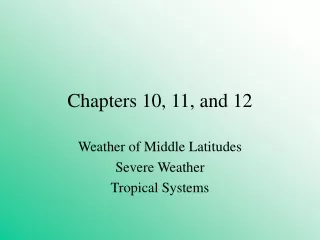
• Chapter 10, 11( except 11.4 and and 11.6 -7) • Intermolecular potentials. Dipole – Dipole, Hydrogen bonding and ion-dipole, ion-ion • Co-existence Curves, Triple point, Critical point

E N D
• Chapter 10, 11( except 11.4 and and 11.6 -7) • Intermolecular potentials. Dipole – Dipole, Hydrogen bonding and ion-dipole, ion-ion • Co-existence Curves, Triple point, Critical point • Solutions. Interactions in solution, Boiling Point Elevation, Freezing Point Depression and Osmotic Pressure, Electrolyte solutions Midterm next Friday: Chaps 9(no 9.7), 10, 11.-11.3 One side of page notes, closed book Review Session Wednesday 20 B Week III Chapters 10 and 11
H2O P-T Phase Diagram PE PE+KE KE
Pressure -Volume Phase Diagram SO2(g)SO2( l) SO2(s) Shows the deviation from Ideal Gas behavior The Real gas behavior is described well by the vdW’s Equation Fig. 10-18, p. 461
P NP NP NP P NP NP P NP P P H-bonds VDW Bond dipole VDW dipole-dipole Bond dipole VDW dipole-dipole VDW dipole-dipole H-bonds P=[nRT/(V– nb)] – [a(n/V)2] n=N/NA and R=Nak Notice the difference between polar molecules (dipole moment ≠0) and non-polar molecules (no net dipole moment =0) CO2 and CH4
-e +e Electro-negativity of atoms Dipole moment =eRe A measure of the charge separation In a molecule the more Electronegative atom in a bond will transfer electron density from the less Electronegative atom This forms dipole along the bond
-e Dipole-Dipole interaction +e Strongest of the physical bonds Except for hydrogen bonds Which are the strongest of the Physical bonds, e.g., (H2O)2 dimer Dipole moment =eRe
vdW’s bonds versus dipolar bonds R (Inter nuclear distance) Between the centers of mass
Chemical bonds versus Physical bonds R (Inter nuclear distance) Between the centers of mass
Minimum Potential Structure of the Dimer: bond angles and bond lengths How did we find this structure in 20A? Which equation did we solve and What approximation allowed us to find this structure for chemical bonds Recall that these are physical bonds and not chemical (electronic) bonds rr R (Internuclear distance) Between the centers of mass R-relative center of mass (cm) positions of the HCl monomers in (HCl) Dimer cm= average mass positions along bond in the HCl monomers. Re m1 m2 r1 r2 cm r2=(m2/m)Re and r1= (m1/m) Re m=m1 + m2
-e +e Dipole moment =eRe A measure of the charge separation and therefore
-e +e Electro-negativity of atoms Dipole moment =eRe A measure of the charge separation In a molecule the more Electronegative atom in a bond will transfer electron density from the less Electronegative atom This forms dipole along the bond
Chemical bonds versus Physical bonds Physical bonds Uses Van der Waals Eq Chemical bonds Do not use Van der Waal’s Eq Why?
P NP NP NP P NP NP P NP P P H-bonds VDW Bond dipole VDW dipole-dipole Bond dipole VDW dipole-dipole VDW dipole-dipole H-bonds P=[nRT/(V– nb)] – [a(n/V)2] n=N/NA and R=Nak Notice the difference between polar molecules (dipole moment ≠0) and non-polar molecules (no net dipole moment =0) CO2 and CH4
Boiling points Or Ze Fig. 10-12, p. 456
H2O P-T Phase Diagram PE PE+KE KE
Density of H2O vs Temperature Fig. 10-15, p. 458
H2O(l) Density of H2O vs Temperature H2O(s) Fig. 10-15, p. 458
H2O P-T Phase Diagram PE PE+KE KE
Rate of evaporation vs time as the vapor pressure approaches Equilibrium Where it equals the condensation Rate H2O(l) H2O(g) Evaporation All the Macroscopic Properties, P, V, and T are only defined at Equilibrium. Which means PV=nRT and the vdW Eq. can only be use under Equilibrium conditions Fig. 10-16, p. 459
H2O P-T Phase Diagram PE PE+KE KE
H2O P-T Phase Diagram Equilibrium Vapor Pressure Super heated H2O liquid Will spontaneously vaporize Super cooled H2O liquid will Spontaneously freeze In both spontaneous processes the system will go to the Equilibrium StatePhase and Pressure Table 10-3, p. 460
Equilibrium Vapor Pressure vs Temperature Fig. 10-17, p. 460
In Solutions, for example when NaCl(s) is dissolved in H2O(l). + H2O NaCl(s) + H2O(l) Na+(aq) +Cl-(aq) (aq) means an aqueous solution, where water is the solvent, major component. The solute is NaCl, which is dissolved, minor component Water molecules solvates the ions the Cation (Na+) and the Anion (Cl-). Fig. 10-6, p. 450
+∂ -2∂ -2∂ + -2∂ Solvated Na+ -2∂ +∂ +∂ Fig. 10-6a, p. 450