Download
1 / 31
310 likes | 394 Views
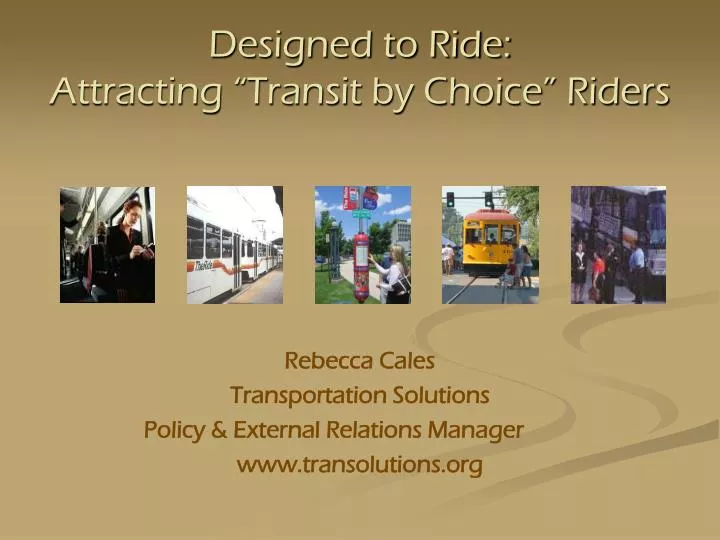
Rebecca Cales Transportation Solutions Policy & External Relations Manager www.transolutions.org. Designed to Ride: Attracting “Transit by Choice” Riders. Transportation Solutions. TMA covering “near southeast Denver”

E N D
Rebecca Cales Transportation Solutions Policy & External Relations Manager www.transolutions.org Designed to Ride:Attracting “Transit by Choice” Riders
Transportation Solutions • TMA covering “near southeast Denver” • Shopping destinations, small & large employers, vibrant urban neighborhoods, private university • Gridlocked roadways
Walkable area with high volumes of pedestrian traffic 60 bus stops with little or no information Cherry Creek Area
Inventory of 60 bus stops Incorrect or inconsistent signage Lack of amenities & information Blend in with landscape 60 Bus Stops – To Where?
Focus Groups Convened to Identify Major Barriers to Transit Use Focus groups (2) • Residents, employees & visitors • Pre-survey • Stop identification • Visual preference survey • Group discussion
Creativity & Practicality • Information, accessibility & visibility • Stops are “invisible” • Unique look/brand • Easy to read/understand • Frequency/knowledge of service • “You are here” • Comfort & convenience
Baseline Data Collection • Resident online survey • Phone survey • Bus passenger counts
Lots of Room for Improvement • I know which bus routes to take to work/school • 28% • Taking the bus to work/school is a realistic option for me • 20% • Bus stops in Cherry Creek provide information I need to ride the bus • 49% • Bus stops in Cherry Creek are attractive • 49% • I feel safe waiting at bus stops • 70%
I know where to get information about transit routes • 66% • I am familiar with routes serving the Cherry Creek area • 39% • I know how to ride the bus • 81% • People like me ride the bus • 41% • Traveling by bus for some of my trips is a realistic option for me • 35%
Travel Modes – Commute Trips • Single occupancy vehicles – 78% • Bike – 1% • Carpool – 2% • Transit – 1% • Walk – 13% • Telework – 3% • Other – 2%
Travel Modes – All Trips • Single occupancy vehicles – 61% • Bike – 4% • Carpool – 4% • Transit – 3% • Walk – 28%
Marketing & Outreach Local ads & public relations started in June in area monthly newspapers and ran through August
Community Events Key chains, magnets, note cards, and “How to Ride” information was given out at community events, meetings and transportation fairs
Try Transit! Guided “Transit Tours” started in July with a trip to Ben & Jerry’s ice cream…
Project Impacts • Resident online survey • Phone survey • Bus passenger counts
Shift of Perception I know which bus routes to take to work/school • 45% up from 28%
Bus stops in Cherry Creek provide the information I need to ride the bus • 68% up from 49%
Bus stops in Cherry Creek are attractive • 75% up from 49%
I feel safe waiting at bus stops • 79% up from 60%
I know where to get bus schedule and route information • 75% up from 66%
I know how to ride the bus • 88% up from 81%
People like me ride the bus • 53% up from 41%
Traveling by bus for some of my trips is a realistic option for me • 47% up from 35%
Travel Modes – Commute Trips • Alt mode usage increased 2% for commute trips
Travel Modes – All Trips • Alt mode usage increased by a total of 6%
Recognized with a 2007 Mayor’s Design Award Celebrates design throughout Denver neighborhoods “Wild Card” winner Celebrating Design
Thank You! Rebecca Cales Policy & External Relations Manager Transportation Solutions rcales@transolutions.org 303.377.7086