Download
1 / 38
380 likes | 506 Views
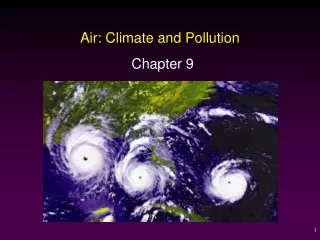
Climate Change Extremes and Air Pollution in California. Michael J. Kleeman Department of Civil and Environmental Engineering UC Davis. Air Pollution Taxonomy. Primary Pollutants. Secondary Pollutants. Produced by chemical reactions in the atmosphere

E N D
Climate Change Extremes and Air Pollution in California Michael J. Kleeman Department of Civil and Environmental Engineering UC Davis
Air Pollution Taxonomy Primary Pollutants Secondary Pollutants Produced by chemical reactions in the atmosphere Concentration determined by emissions, wind speed, PBL height, precipitation, temperature, humidity, UV, etc. • Emitted directly from a source to the atmosphere • Concentration determined by emissions rate, wind speed, PBL height, and precipitation Conc = emissions / (wind * height) wind (m/sec) height (m) emissions (kg/sec) http://acmg.seas.harvard.edu/people/faculty/djj/book/bookchap11.html
Major Air Pollutants: Ozone and Particles • Ozone (O3) is a chemical oxidant (reactive!) • Produced by CxHyOz + NOx -> O3 • inflammation of lung tissue, pulmonary and nasal congestion, coughing and wheezing, aggravates asthma, decreases resistance to pneumonia and bronchitis • Airborne Particles (PM10, PM2.5) • Emitted directly or formed by chemical reaction • Associated with increased death rate even at low concentrations (15 µg m-3)
Early Extreme Air Pollution Event: The London Fog Source: http://www.portfolio.mvm.ed.ac.uk/studentwebs/session4/27/greatsmog52.htm
More Recent Health Effects Data for Airborne Particles: The Six Cities Study Source: DOCKERY DW, POPE CA, XU XP, et al. “AN ASSOCIATION BETWEEN AIR-POLLUTION AND MORTALITY IN 6 UNITED-STATES CITIES”, NEW ENGLAND JOURNAL OF MEDICINE 329 (24): 1753-1759 DEC 9 1993.
PM2.5 Concentrations in the US: 30,000 – 50,000 deaths each year Source: US EPA (http://www.epa.gov/air/airtrends/2007/report/particlepollution.pdf).
California’s Major Air Basins San Joaquin Valley South Coast Air Basin
PM10 Time Trends 1980-2003 Riverside (Southern California) Emissions changes make this a “non-stationary” signal. We spend a lot of money to purchase this decrease over time. Will climate change reduce the effectiveness of our emissions control programs?
Over-view of Climate Air Quality Modeling System Statistical downscaling for PM doesn’t work well in California. Dynamic downscaling studies are expensive. How well do they work? Source: A. Mahmud, M. Hixson, J. Hu, Z. Zhao, S.H. Chen, M.J. Kleeman, “Climate impact on airborne particulate matter concentrations in California using seven year analysis periods”, Atmos. Chem. Phys. Discuss., 10, 1–35, 2010.
Seven-year Average PM2.5 Concentrations in California PM2.5 Organic Compounds PM2.5 Nitrate
Comparison: Modeled vs Observed (2000-06) • Observed data obtained from the California Air Resources Board (CARB ) • Six sites in California:Central Los Angeles (CELA), San Jose (SJ4), Fresno (FSF), Modesto (M14), Visalia (VCS), and Sacramento (S13) PM2.5 Total Mass Comparison Source: A. Mahmud, M. Hixson, J. Hu, Z. Zhao, S.H. Chen, M.J. Kleeman, “Climate impact on airborne particulate matter concentrations in California using seven year analysis periods”, Atmos. Chem. Phys. Discuss., 10, 1–35, 2010.
WRF Over-predicts Wind Speed During Pollution Events in California
Are WRF Predictions for Wind Speed Too “Noisy” During Pollution Events? Simulation with PCM Simulation with GFS
Change in Annual Average Airborne Particle Concentrations Due to Climate is Smaller than Inter-Annual Variability Probability that Calculations show a Statistically Significant Change Change in 7-Year Average Airborne Particle Concentrations Due to Climate Green=Less Certain Blue=More Certain Red=Increased Blue=Decreased
Analysis of Extreme Events: 99th Percentile Days in 2000-06 vs. 2047-53
Increase in Airborne Particle Concentrations During Future Extreme Events Due to Climate Difference in 99th Percentile PM2.5 Caused by Climate 99th Percentile PM2.5 2047-53 (max=58 µg/m3) 99th Percentile PM2.5 2000-06 (max=46µg/m3)
Ozone Concentrations in the US Source: US EPA (http://www.epa.gov/air/airtrends/2007/report/groundlevelozone.pdf).
Ozone Formation Increases at Warmer Temperatures Statistical Evidence from Measurements Predictions from Reactive Chemical Transport Models Los Angeles
Decreasing Ozone Climate Penalty Can Be Understood Using An “Isopleth” Diagram Solid black lines mark contours of constant ozone concentrations 43ppb 75ppb Dashed line shows our emissions trajectory between 1990 - 2020
Do Extreme Temperatures Always Produce Extreme Ozone Concentrations? Source: A. Steiner, A. Davis, S. Sillman, R. Owen, A. Michalak, and A. Fiore, “Observed Suppression of Ozone Formation at Extremely High Temperatures Due to Chemical and Biophysical Feedbacks”, PNAS, 107, P 19685-19690, 2010.
Conclusions • Air pollution events driven by emissions as well as meteorology – we don’t have emissions models that can predict extreme events (traffic jams, factory upsets, etc) • Regional climate models must accurately predict wind speed and PBL height during low wind speed “extreme events” – either summer or winter events • Regional climate models must accurately predict high and low extreme temperatures – either summer or winter events • Ozone “Climate-Penalty” is shrinking over time, but it likely won’t go to zero and it may rebound • Climate does not strongly affect annual-average PM, but effects on extreme events may be stronger
Temperature Changes2000-06 vs. 2047-53 ΔTemperature Summer (oC) Δ Temperature Winter (oC) Source: Z. Zhao, S. Chen, and M. Kleeman, “The Impact of Climate Change on Air Quality Related Meteorological Conditions in California – Part II: Present versus Future Time Simulation Analysis”, Climate Change, submitted, 2010.
Humidity Changes (%)2000-06 vs. 2047-53 Source: A. Mahmud, M. Hixson, J. Hu, Z. Zhao, S.H. Chen, M.J. Kleeman, “Climate impact on airborne particulate matter concentrations in California using seven year analysis periods”, Atmos. Chem. Phys. Discuss., 10, 1–35, 2010.
Climate Impact May Be Stronger on Severe Airborne Particle Events Increase in Airborne Particle Concentrations During Future Extreme Events Due to Climate Population Exposure During Extreme Events
Criteria Pollutant Emissions Reductions Associated With Climate Mitigation: AB32 Level 1 – Industrial Level 2 – Electric Utilities & Natural Gas Level 3 – Agricultural Level 4 – On-road vehicles Level 5 – Off-road vehicles
AB32 Has Different Impact on Each Criteria Pollutant Emissions Rate
AB32 Reduces Population Exposure to PM2.5 as a Co-Benefit of GHG Mitigation (a) Change in population-weighted PM2.5 in California (b) Change in population-weighted PM2.5 in Los Angeles
S-3-05: More Aggressive GHG Mitigation Strategies Have Bigger Co-Benefits (a) Change in population-weighted PM2.5 in California (b) Change in population-weighted PM2.5 in Los Angeles
Climate Predictions For 2001 vs. 2050 Using 36 km Resolution Source:: Tagaris E, Liao KJ, Delucia AJ, Deck L, Amar P, Russell AG, “Potential Impact of Climate Change on Air Pollution-Related Human Health Effects”, Environ. Sci. Technol., 43, 4979-4988, 2009.
Climate Predictions For 2001 vs. 2050 Using Averaged Meteorology Source:: Millstein, D.E., and Harley, R.A. “Impact of Climate Change on Photochemical Air Pollution in southern California”, Atmos. Chem. Phys., 9, 3745-3754, 2009.