Download
1 / 37
490 likes | 999 Views
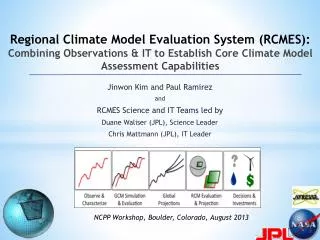
Jet Propulsion Laboratory California Institute of Technology. Statistical Downscaling using the Regional Climate Model Evaluation System (RCMES). RCMES team at Jet Propulsion Laboratory. APEC Climate Center Training Program 2014 Busan, South Korea August 29, 2014. http://rcmes.jpl.nasa.gov

E N D
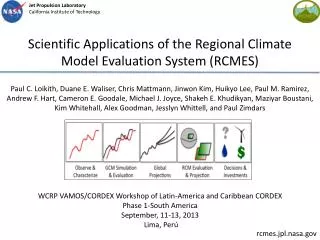
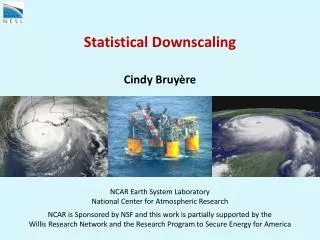
Jet Propulsion LaboratoryCalifornia Institute of Technology Statistical Downscaling using the Regional Climate Model Evaluation System (RCMES) RCMES team at Jet Propulsion Laboratory APEC Climate Center Training Program 2014 Busan, South Korea August 29, 2014 http://rcmes.jpl.nasa.gov http://climate.apache.org Courtesy of Dr. Paul Loikith
Today’s Agenda 9:00-9:50: Welcome and introduction to RCMES and statistical downscaling tools 10:00-11:00: RCMES demo and installation 11:00-13:00: Activity #1: Compare four different downscaling approaches 13:00-14:00: Lunch 14:00-15:00: Group discussion of Activitiy#1 results 15:00-17:00: Activity #2: Compare climate change scenarios (RCP 4.5 vs. RCP 8.5) 17:00-18:00: Group discussion of Activitiy #2 results 18:00 : Adjourn
RCMES Motivation & Goals RCMES GOALS • Make observation datasets, with some emphasis on satellite data, more accessible to the RCM community. • Make the evaluation process for regional climate models simpler, quicker and physically more comprehensive. • Provide researchers more time to spend on analysing results and less time coding and worrying about file formats, data transfers, etc. BENEFITS • Quantify model strengths/weaknesses for development/improvement efforts • Improved understanding of uncertainties in predictions
The Regional Climate Model Evaluation System (RCMES) • Joint collaboration: JPL/NASA, UCLA • Two main components • Database of observations • Toolkit for model evaluation and statistical downscaling • Python-based open source software powered by the Apache Open Climate Workbench (OCW)
Meet the RCMES Team Climate Science Team: Duane Waliser (PI, JPL/Caltech, UCLA), Paul Loikith (JPL/Caltech), Huikyo Lee (JPL/Caltech), Jinwon Kim (UCLA), Kim Whitehall (Howard University), Danielle Groenen (Florida State University) Computer Science/Development Team: Chris Mattmann (PI, JPL/Caltech, UCLA), Paul Ramirez (JPL/Caltech), Cameron Goodale (JPL/Caltech), Michael Joyce (JPL/Caltech), MaziyarBoustani (JPL/Caltech), Andrew Hart (JPL/Caltech), ShakehKhudikyan (JPL/Caltech), JesslynWhittel (University of California, Berkeley), Alex Goodman (Colorado State University) rcmes.jpl.nasa.gov
Regional Climate Model Evaluation System High-Level Architecture Other Data Centers (ESG, DAAC, ExArch Network) User input Model data URL Extract OBS data Extract model data TRMM Metadata MODIS Regridder (Put the OBS & model data on the same time/space grid) Data Table Use the re-gridded data for user’s own analyses and VIS. Data Table Extractor for various data formats AIRS Data Table • PostgreSQL Data extractor (Binary or netCDF) CERES Data Table Metrics Calculator (Calculate evaluation metrics) Data Table Soil moisture Data Table Common Format, Native grid, Efficient architecture Visualizer (Plot the metrics) ETC Raw Data: Various sources, formats, Resolutions, Coverage RCMED (Regional Climate Model Evaluation Database) A large scalable database to store data from variety of sources in a common format RCMET (Regional Climate Model Evaluation Toolkit) A library of codes for extracting data from RCMED and model and for calculating evaluation metrics RCMESHigh-level technical architecture RCMESHigh-level technical architecture RCM data RCM data user choice user choice URL URL TRMM TRMM Extract OBS data Extract OBS data Extract RCM data Extract RCM data Metadata Metadata User’s own codes for ANAL and VIS. User’s own codes for ANAL and VIS. Data Table Data Table MODIS MODIS Regridder Put the OBS & RCM data on the same grid for comparison Regridder Put the OBS & RCM data on the same grid for comparison Data Table Data Table Extractor Extractor AIRS AIRS MySQL MySQL Data extractor (Fortran binary) Data extractor (Fortran binary) Data Table Data Table Metrics Calculator Calculate comparison metrics Metrics Calculator Calculate comparison metrics SWE SWE Data Table Data Table Data Table Data Table Data extractor (Fortran binary) Data extractor (Fortran binary) Soil moisture Soil moisture Data Table Data Table Visualizer Plot the metrics Visualizer Plot the metrics Common Format, Native grid, Efficient architecture Common Format, Native grid, Efficient architecture ETC ETC Raw Data: Various Formats, Resolutions, Coverage Raw Data: Various Formats, Resolutions, Coverage RCMET (Regional Climate Model Evaluation Toolkit) A library of codes for extracting data from RCMED and model and for calculating evaluation metrics RCMET (Regional Climate Model Evaluation Toolkit) A library of codes for extracting data from RCMED and model and for calculating evaluation metrics RCMED (Regional Climate Model Evaluation Database) A large scalable database to store data in a common format RCMED (Regional Climate Model Evaluation Database) A large scalable database to store data in a common format
Regional Climate Model Evaluation Database (RCMED)Remote Sensing,In Situ, Reanalysis • Temperature (AIRS, CRU, UDEL) • Precipitation (TRMM, CRU, UDEL, CPC, GPCP) • Radiation/clouds (CERES, MODIS) • Sea surface height (AVISO) • Sea surface temperature (AMSRE) • Winds (QuikSCAT) • Multivariate reanalysis (MERRA, NARR, NLDAS, ERA-Interim) • Snow Water Equivalent (SNODAS) • Evapotranspiration (RHEAS) • More to come…
Regional Climate Model Evaluation Toolkit (RCMET) • Subset data temporally and spatially • Interpolates observations and models to common grid • User defined • Bi-linear, scipy.interpolate.griddata • Computes and visualizes commonly used metrics (bias, Taylor Diagrams, etc.) • RCMET is built as a Python library with a growing number of useful functions to facilitate model evaluation and statistical downscaling. Taylor Diagrams Portrait Diagrams Bias Maps Kim, J., D. E. Waliser, C. A. Mattmann, L. O. Mearns, C. E. Goodale, A. F. Hart, D. J. Crichton, S. McGinnis, H. Lee, P. C. Loikith, and M. Boustani, 2013: Evaluation of the Surface Air Temperature, Precipitation, and Insolation over the Conterminous U.S. in the NARCCAP Multi-RCM Hindcast Experiment Using RCMES, J. Climate, 26, 5698-5715.
NARCCAP Cloud-precipitation-radiation relationship Poor agreement for HRM3 Lee, H., J. Kim, D. E. Waliser, P. C. Loikith, C. A. Mattmann, and S. McGinnis (2014), Evaluation of simulation fidelity for precipitation, cloud fraction and insolation in the North America Regional Climate Change Assessment Program (NARCCAP). rcmes.jpl.nasa.gov
Evaluation of NARCCAP Temperature PDFs and Extremes Skewness=-1 • Most models reproduce boundary between primarily positive and negative skewness well • Skewness is primarily positive in north where large warm temperature excursions occur due to infrequent warm advection from south, these are not possible on cold tail • Coherent area of negative skewness from Pacific Ocean to Great Lakes is well simulated • Observational uncertainty low-NARR and MERRA agree well Surface temperature skewness Loikith, P. C., D. E. Waliser, J. Kim, H. Lee, B. R. Lintner, J. D. Neelin, S. McGinnis, C. Mattmann, and L. O. Mearns, Surface Temperature Probability Distributions in the NARCCAP Hindcast Experiment: Evaluation Methodology, Metrics and Results, under review for J. Climate. rcmes.jpl.nasa.gov
Ongoing Model Evaluation Studies Not just for RCMs, CMIP data too! Bayesian model averaging for optimal multi-model ensemble configurations. (Huikyo Lee - lead) Large scale meteorological patterns associated with temperature extremes over North America (Paul Loikith - lead ) K-means clustering to evaluate surface temperature variance and skewness over South America (Huikyo Lee - lead).
Ways to Use RCMES • RCMES in a virtual machine environment • Downloadable from rcmes.jpl.nasa.gov/downloads • Comes with all Python libraries and dependencies installed • RCMES on Mac or Linux machine • Source code downloadable from http://climate.incubator.apache.org/ • Requires all necessary Python libraries installed on local machine • Can interact programmatically or with a point and click user interface.
CORDEX Interactions & Support • N. America –NARCCAP via NCAR/Mearnsfor U.S. NCA • Africa– collaboration with UCT/Hewitson& RossbyCtr/Jones • E. Asia – exploring collaboration with KMA & APCC, particip. in Sep’11 & Nov’12 mtgs • S. Asia – collaboration with IITM/Sanjay, participated Oct’12 & Sep’13 mtgs. • Arctic – participated in initial Mar’12 mtgand Nov’13 and Jun’14 • Caribbean, S. America –participated in 1st major mtg Sep’13 and 2nd Apr’14 • Middle East – N. Africa –participating in initial coordinating team and Friday’s mtg Typically try to support meetings by sending a climate scientist and an IT expert, provide an overview and a tutorial/training. Have hosted scientists & students at JPL/UCLA Learning RCM User Needs Infusing Support into CORDEX
Future Direction • Development is ongoing… • Expansion of database • Adding more metrics and downscaling methods to RCMET • Growing user and developer base • Connection to Earth System Grid Federation (ESGF) • Improving user experience
Why do we need to downscale GCM outputs? • Global climate models (GCMs) cannot simulate climate at the local to regional scale. • Most of downscaling studies in the United States have used one of five methods [Stoner et al., 2013]. • dynamical downscaling: simulation of regional climate models (RCMs). • delta method • bias correction – spatial disaggregation (BCSD) • asynchronous regression approach • bias corrected constructed analogue (BCCA)
Statistical downscaling (http://www.glisaclimate.org/)
Statistical downscaling using RCMES • Four different methods • Delta method (addtion) • Delta method (bias correction) • Quantile mapping • Asynchronous linear regression • RCMES database provides observational data to determine the observation-model relationship.
Data • NASA’s Tropical Rainfall Measuring Mission (TRMM) data: precipitation [mm/day], 0.25°x 0.25°, monthly, 1998-2013. • Climate Research Unit (CRU) data: mean/maximum/minimum temperatures near surface [K], precipitation [mm/day], 0.25°x 0.25°, monthly, 1998-2013. • Three CMIP5 model outputs (IPSL, MIROC5 and MPI) from the decadal 1980 experiment, RCP 4.5 and RCP 8.5 scenarios. • TRMM and CRU data can be downloaded from RCMED.
Spatial aggregation of observational data Y1 grid boxes of observational data: fine resolution Y2 • To downscale climate variables at a specific location (star marker), RCMET uses • the nearest model grid point data (x1), and • observational data from surrounding grid points (y1,y2, y3, y4). X1 Y4 Y3 grid boxes of model data: coarse resolution
Delta method(Delta addition) • (future climate) = (present observation) + (mean difference between Y0 and Y1) delta delta
Delta method(Bias correction) • (future climate) = (future simulation) + (mean bias) bias bias
Quantile mapping • (future climate) = (bias corrected future simulation) • Bias is corrected for each quantile. biases biases
Asynchronous linear regression • The linear relationship between observation and present simulation is determined after sorting them in ascending order.
? Are you ready to use RCMES on your laptop?Please cOPY ‘APCC-training2014’ folder from the usb thumb drive to the desktop of your laptop.
Installation of Virtual Box (APCC-training2014/software/VirtualBox) • Virtual Box is free software. • It allows guest operating system to be loaded and run. • Our .ova file includes Linux OS, Python and RCMES software. So users can easily install and run RCMES regardless of their computers’ operating system. • Just double click XXX.ova after installing Virtual Box. click ‘Install’
Installation without using Virtual Box (step-by-step) • https://cwiki.apache.org/confluence/display/CLIMATE/Home
Click ‘Import’ click
Setting up a shared folder between the virtual machine and your laptop click • ID: vagrant • Password: vagrant
statistical_downscaling.py (1) A folder named as ‘case_name’ is generated under the examples folder and saves all plots and results. • case_name = ‘Nairobi_DJF_tas’ • location_name= ‘Nairobi' # no space between characters Search geographic coordinate of cities on Google. (ex) latitude and longitude of Nairobi): 1.28S, 36.82E • grid_lat = -1.28 • grid_lon = 36.82
statistical_downscaling.py (2) To downscale simulated data in August, • month_index= [8] To downscale simulated data from December through February, • month_index = [12, 1, 2] # reference (observation) data • REF_DATA_NAME = "CRU" • REF_FILE = "/home/vagrant/workshop/datasets/observation/pr_cru_monthly_1981-2010.nc" • REF_VARNAME = "pr"
statistical_downscaling.py (3) # model data (present) • MODEL_DATA_NAME = "IPSL" • MODEL_FILE = "/home/vagrant/workshop/datasets/model_present/pr_Amon_IPSL_decadal1980_198101-201012.nc" • MODEL_VARNAME = "pr" # model data (future) • FUTURE_SCENARIO_NAME = "RCP4.5_2041-70" • MODEL_FILE2 = "/home/vagrant/workshop/datasets/model_rcp45/pr_Amon_IPSL_rcp45_204101-207012.nc" # downscaling method (1: delta addition, 2: Delta correction, 3: quantile mapping, 4: asynchronous regression) • DOWNSCALE_OPTION = 1
Compile and run statistical downscaling > python statistical_downscaling.py • You can access example/case_name folder on both your Virtual Box Linux and windows. • downscaling_location: map with a marker • histograms of the original and downscaled data • spreadsheet including downscaling location, months, observational and model data, and downscaled data
Activity #1: Compare four different downscaling approaches • Change ‘DOWNSCALE_OPTION’ • 1: Delta addition: does not correct the simulation result for present climate • 2: Delta correction • 3: Quantile mapping • 4: Asynchronous linear regression
Activity #2: Compare climate change scenarios • Change ‘FUTURE_SCENARIO_NAME’ and ‘MODEL_FILE2’ • 1: RCP 4.5 for 2041-2070 • 2: RCP 4.5 for 2071-2100 • 3: RCP 8.5 for 2041-2070 • 4: RCP 8.5 for 2071-2100
References • About RCMES and OCW • Mattmann et al. (2014), Cloud computing and virtualization within the Regional Climate Model and Evaluation System, Earth Science Informatics. • Kim, J., et al. (2013), Evaluation of the surface air temperature, precipitation, and insolation over the conterminous U.S. in the NARCCAP multi-RCM hindcast experiment using RCMES, Journal of Climate. • Whitehall et al. (2012), Building model evaluation and decision support capacity for CORDEX, WMO Bulletin. • Crichton et al. (2012), Sharing Satellite Observations with the Climate-Modeling Community: Software and Architecture, IeeeSoftware. • About statistical downscaling • Wood et al. (2004), Hydrologic implications of dynamical and statistical approaches to downscale climate model outputs, Climate Change. • Stoner et al. (2013), An asynchronous regional regression model for statistical downscaling of daily climate variables, International Journal of Climatology. • Maraun (2013), Bias correction, quantile mapping, and downscaling: revisiting the inflation issue, Journal of Climate. • Juneng et al. (2010), Statistical downscaling forecasts for winter monsoon precipitation in Malaysia using multimodel output variables, Journal of Climate. • O’Brien et al. (2001), Statistical asynchronous regression: Determining the relationship between two quantiles that are not measured simultaneously, Journal of Geophysical Research.
Where to find more information: • http://rcmes.jpl.nasa.gov • http://climate.apache.org/ • Email team members or dev@climate.apache.org Contacts: Kyo Lee: huikyo.lee@jpl.nasa.gov