Download
1 / 12
120 likes | 127 Views
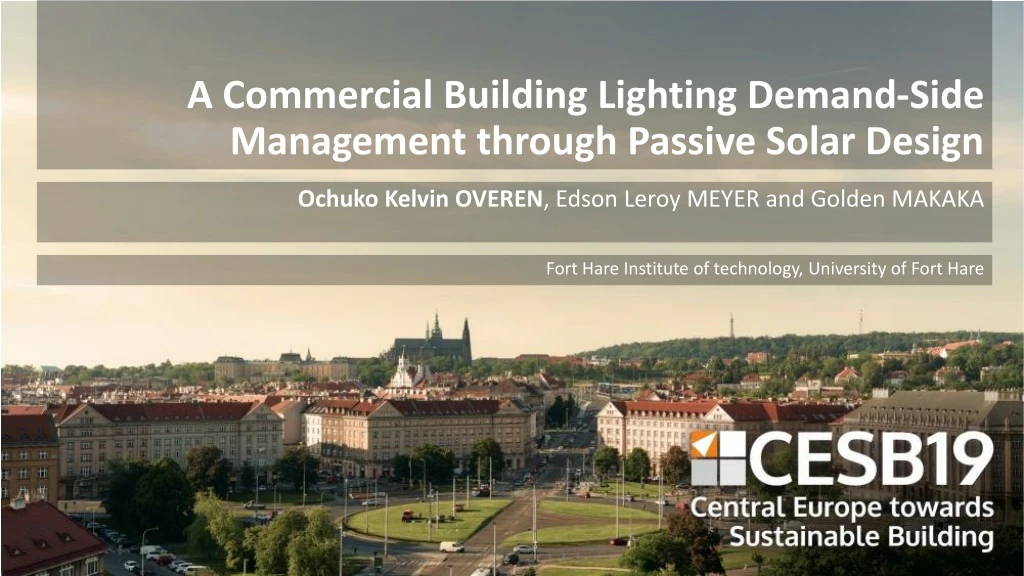
Fort Hare Institute of technology, University of Fort Hare. Ochuko Kelvin OVEREN , Edson Leroy MEYER and Golden MAKAKA. A Commercial Building Lighting Demand-Side Management through Passive Solar Design. Background.

E N D
Fort Hare Institute of technology, University of Fort Hare Ochuko Kelvin OVEREN, Edson Leroy MEYER and Golden MAKAKA A Commercial Building Lighting Demand-Side Management through Passive Solar Design
Background The aim of this study is to analyse the indoor daylight illuminance of a passive solar office building and the potential demand-side management 1185
Synopsis • Description of the building and location • Methodology • Indoor illuminance measurement • Demand-side management estimation • Results and discussions • Daylight and electric light illuminance • Light demand-side management • Conclusions 1185
Description of the building and location • Latitude 32.8° south and longitude 26.8° east • At an altitude of 540 m in the Eastern Cape of South Africa • An average dry bulb temperature of 29°C in summer and 15°C in winter • An average solar radiation of 606.06 W/m2 in summer and 346.17 W/m2 in winter Photo of the passive solar building Space layout of the building 1185
MethodologyIndoor illuminance measurement LI-210R cosine photometric sensor • Sense visible light as perceived by the human eyes • Measures incident radiation from all directions • Sensitivity of 30 µA per 100 klux and response time of <1 µs West side photometric sensor East side photometric sensor Experimental setup 1185
MethodologyDemand-side management estimation Lighting energy consumption and savings. • Recommended illuminance for office activities 300 lux • Electric lights are controlled by Daylight Switch Controller (DSC) • The lighting energy savings due to the utilization of DSC is given as (kWh); (1) where • = lighting energy consumption without the use of DSC (Baseline) (wh) • = lighting energy consumption due to the use of DSC (wh) Economic impact or benefit (2) where • = energy charge per unit (c/kWh) 1185
Results and discussionsDaylight and electric light illuminance The average indoor illuminance without daylight: • 460 lux in Region (a) • 31 lux in Region (b) Average daylight illuminance indoors (07h00 – 17h00): • 850 lux in both Regions • Combine electric and daylighting illuminance was 1300 lux (a) All lights switched on (b) All lights switched off (a) Average indoor illuminance of the office space 1185
Results and discussionsDaylight and electric light illuminance • 910 lux • Combine electric and daylighting illuminance was 1360 lux Clear sky day Overcast sky day Average daylight illuminance indoors (07h00 – 17h00): • 170 lux in both regions • Combine electric and daylighting illuminance was 620 lux 1185
Results and discussionsLighting energy consumption and savings • 8 x 58 W cool white fluorescent fittings were used to illuminate the office space. • Total wattage of 0.46 kW • Daily baseline cumulative energy consumption was 11.14 kWh. 4% (0.46 kWh/day) 35% (3.98 kWh/day) Clear sky day Overcast sky day 1185
Results and discussionsEconomic impact and benefits MegaFlex energy charge tariff structure 853.41 USD in HDS 1421.04 USD in LDS • All TOU periods and demand seasons were taken into consideration. • 1.00 USD equivalents to 14.24 Rand (ZAR) • 15% VAT rate Lighting energy expenditure • 27.53 USD/day in high demand season • 14.84 USD/day in low-demand season Clear sky day 109.00 USD in HDS 187.28 USD in LDS Overcast sky day 1185
Conclusions • The admitted daylight in the building was found to be sufficient for office tasks but required supplementary electric lighting in overcast days. • Implementation of daylighting reduces the cumulative daily lighting energy consumption by 35% on a clear sky day and 4% on overcast sky day. • Annual monetary benefit of daylighting in the building was estimated at 1285.36 USD. 1185
Ochuko Kelvin OVEREN ooveren@ufh.ac.za 1185