Download
1 / 41
410 likes | 529 Views
Gathering Feedback for Teaching. January 10, 2012. Moderator. Circe Stumbo President, West Wind Education Policy, Inc., and consultant to CCSSO/SCEE. Welcome. Janice Poda, CCSSO Initiative Director Education Workforce. Purposes.

E N D
Gathering Feedback for Teaching January 10, 2012
Moderator • Circe Stumbo • President, West Wind Education Policy, Inc., and consultant to CCSSO/SCEE
Welcome • Janice Poda,CCSSO • Initiative Director Education Workforce
Purposes To provide SCEE members with an overview of MET Project, inform them of the latest findings, and provide a forum for discussing implications for the educator workforce
Objectives will: • Become familiar with the MET project’s goals and how the study was designed and conducted • Hear about the latest research findings
Objectives • Learn about the implications for important policy issues that influence teacher and leader evaluation systems • Be able to ask questions about these findings and the implications
Presenter Steve Cantrell, Senior Program Officer (Research & Data) Bill & Melinda Gates Foundation
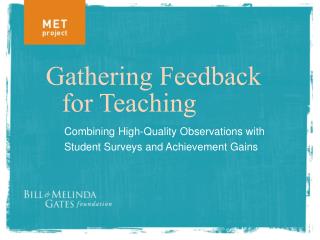
Combining High-Quality Observations with Student Surveys and Achievement Gains Gathering Feedback for Teaching
The Measures of Effective Teaching Project Participating Teachers • Two school years: 2009–10 and 2010–11 • >100,000 students • Grades 4–8: ELA and Math • High School: ELA I, Algebra I and Biology
MET Logical Sequence Measures reliable Measures predict Research Use Measures stable under pressure Measures fairly reflect teacher ? Effective Teaching Index Measures combine Teaching Effectiveness Dashboard Measures communicated effectively Measures improve effectiveness
The MET project is unique … • in itsscale, 3,000 teachers 22,500 observation scores (7,500 lesson videos x 3 scores) 900 + trained observers 44,500 students completing surveys and supplemental assessments • in the number of indicators tested, 5 observation instruments. Student surveys Tripod (Ron Ferguson) Value-added on state tests • and in the number of student outcomes studied. Gains onstate math and ELA tests Gains on supplemental tests (BAM & SAT9 OE) Student-reported outcomes (effort and enjoyment in class)
Four Steps Four Steps to High-Quality Classroom Observations
Step 1: Define ExpectationsFramework for Teaching (Danielson) Four Steps
Step 2: Ensure Accuracy of Observers Four Steps
Step 3: Monitor Reliability Four Steps
Multiple ObservationsLeads to Higher Reliability Four Steps NOTES: The numbers inside each circle are estimates of the percentage of total variance in FFT observation scores attributable to consistent aspects of teachers’ practice when one to four lessons were observed, each by a different observer. The total area of each circle represents the total variance in scores. These estimates are based on trained observers with no prior exposure to the teachers’ students, watching digital videos. Reliabilities will differ in practice. See the research paper, Table 11, for reliabilities of other instruments.
Step 4: Verify Alignment with Outcomes Teachers with Higher Observation Scores Had Students Who Learned More Four Steps
We Compare using Three Criteria: Dynamic Trio Predictive power: Which measure could most accurately identify teachers likely to have large gains when working with another group of students? Reliability:Which measures were most stable from section to section or year to year for a given teacher?Potential for Diagnostic Insight: Which have the potential to help a teacher see areas of practice needing improvement? (We’ve not tested this yet.)
Measures have different strengths …and weaknesses Dynamic Trio H M L M H H L M H
Student Feedback is Related to Achievement Gains Rank Survey Statement Student survey items with strongest relationship to middle school math gains: • Students in this class treat the teacher with respect 1 • My classmates behave the way my teacher wants them to 2 3 • Our class stays busy and doesn’t waste time 4 • In this class, we learn a lot every day 5 • In this class, we learn to correct our mistakes Student survey items with the weakest relationship to middle school math gains: • I have learned a lot this year about [the state test] 38 39 • Getting ready for [the state test] takes a lot of time in our class Note: Sorted by absolute value of correlation with student achievement gains. Drawn from “Learning about Teaching: Initial Findings from the Measures of Effective Teaching Project”. For a list of Tripod survey questions, see Appendix Table 1 in the Research Report.
Combining Observations with Other Measures Improved Predictive Power Dynamic Trio
The Reliability and Predictive Power of Measures of Teaching: .25 VA alone Combined (Criterion Weights) .2 Combined (Equal Weights) .15 Tripod alone Difference in Math VA (Top 25% vs. Bottom 25%) .1 FFT alone .05 0 .1 .2 .3 .4 .5 .6 .7 Reliability Note: Table 16 of the research report. Reliability based on one course section, 2 observations. Combining Measures Improved Reliability Dynamic Trio as well as Predictive Power Note: For the equally weighted combination, we assigned a weight of .33 to each of the three measures. The criterion weights were chosen to maximize ability to predict a teacher’s value-added with other students. The next MET report will explore different weighting schemes.
Compared to MA Degrees and Years of Experience, the Combined Measure Identifies Larger Differences … on state tests Compared to What?
…and on low stakes assessments Compared to What?
…as well as on student-reported outcomes. Compared to What?
The MET project reporting timeline: • Student Perceptions 12/2010 • Classroom Observations1/2012 • Weighting mid-2012 • Rationale for different weighting schemes • Consequences for predictive power and reliability • Final report using random assignmentmid-2012 • Do “value-added” estimates control adequately for student characteristics? • Do they predict outcomes following random assignment? MET project reports available at www.metproject.org
Validation Engine System picks observation rubric & trains raters Raters score MET videos of instruction • Software provides analysis of: • Rater consistency • Rubric’s relation to student learning
What the Participants Said…. • The MET Project is ultimately a research project. Nonetheless, participants frequently tell us they have grown professionally as a result of their involvement. Below is a sampling of comments we received. • From Teachers: • “The video-taping is what really drew me in, I wanted to see not only what I’m doing but what are my students doing. I thought I had a pretty good grasp of what I was doing as a teacher, but it is eye opening … I honestly felt like this is one of the best things that I have ever done to help me grow professionally. And my kids really benefited from it, so it was very exciting.” • "With the videos, you get to see yourself in a different way. Actually you never really get to see yourself until you see a video of yourself. I changed immediately certain things that I did that I didn't like.” • “I realized I learned more about who I actually was as a teacher by looking at the video. I learned of the things that I do that I think that I’m great at I was not so great at after all.” • “Even the things I did well, I thought, ok that's pretty good, why do I do that, and where could I put that to make it go farther. So it was a two-way road, seeing what you do well, and seeing the things that have become habits that you don't even think about anymore." • From Raters: • “Being a rater has been a positive experience for me. I find myself ‘watching’ my own teaching more and am more aware of the things I should be doing more of in my classroom.” • “I have to say, that as a teacher, even the training has helped me refine my work in the classroom. How wonderful!” • “I have loved observing teachers, reflecting on my own teaching and that of the teachers teaching in my school.”
Research Partners • Our primary collaborators include: • Mark Atkinson, Teachscape • Nancy Caldwell, Westat • Ron Ferguson, Harvard University • Drew Gitomer, Educational Testing Service • Eric Hirsch, New Teacher Center • Dan McCaffrey, RAND • Roy Pea, Stanford University • Geoffrey Phelps, Educational Testing Service • Rob Ramsdell, Cambridge Education • Doug Staiger, Dartmouth College • Other key contributors include: • Joan Auchter, National Board for Professional Teaching Standards • Charlotte Danielson, The Danielson Group • Pam Grossman, Stanford University • Bridget Hamre, University of Virginia • Heather Hill, Harvard University • Sabrina Laine, American Institutes for Research • Catherine McClellan, Clowder Consulting • Denis Newman, Empirical Education • Raymond Pecheone, Stanford University • Robert Pianta, University of Virginia • Morgan Polikoff, University of Southern California • Steve Raudenbush, University of Chicago • John Winn, National Math and Science Initiative
Upcoming Webinars Special webinar on ESEA Flexibility, Principle 3, Wednesday, January 11, 2-3 pm EST Regular monthly webinars, the second Tuesday of each month, from 2:00-3:00 or 3:30 p.m. EDT