Download
1 / 21
210 likes | 348 Views
MBoMS Genomics of Model Microbes Lab 5: Recap of Taxplot and Alignments. Comparing Microbial Genomes. Last time you learned how to find specific genes in a target microbial genome

E N D
MBoMSGenomics of Model MicrobesLab 5: Recap of Taxplot and Alignments
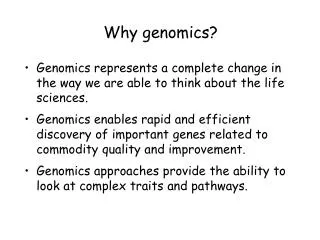
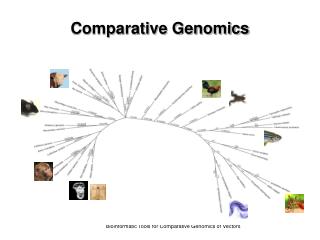
Comparing Microbial Genomes • Last time you learned how to find specific genes in a target microbial genome • Often, you will be less interested in a specific gene or protein and more interested in making more sweeping comparisons between genomes • The exercised in this lab will teach you how to employ several NCBI-based genome comparison tools
Exercise 1 • Go to the Microbial Genome Resource Page • Find the tool box on the right edge • Click on TaxPlot • Use help to learn a bit about TaxPlot
Taxplot • What is taxplot? • A three-way genome comparison tool based on pre-computed protein BLASTP E-values • It displays a point for each protein in the reference genome based on the best alignment with proteins in each of the two genomes being compared • What is new about taxplot • It employs the BLAST Score Ratio (BSR) approach, which classifies all putative peptides within three genomes using a measure of similarity based on the ratio of BLAST scores • BSR analysis is a departure from traditional genome scale analyses as it overcomes the limitations of BLAST E-values in comparative studies by normalizing the BLAST raw scores. • What does taxplot provide? • The output of the BSR analysis enables global visualization of the degree of proteome similarity between all three genomes • Additional output enables the genomic synteny (conserved gene order) between each genome pair to be assessed • The synteny analysis is overlain with BSR data as a color dimension, enabling visualization of the degree of similarity of the peptides being compared
Exercise 2 • Now, use TaxPlot to compare multiple genomes from each of your two species • In TaxPlot, choose 3 genomes for one of your species • you can scroll through the options at the top of the page to find all available genomes for each species • Let TaxPlot calculate the relationships between the 3 genomes • Repeat for the second species
Sample TaxPlot:E. coli 101 vs E. coli K12 vs E. coli 0157:H7 523 hits 1002 equal hits K12 and 0157 Share a large Number of proteins That are equally similar to 101 K12 and 101 share the greatest similarity 2120 hits 4238 query proteins produced 3645 hits
Sample TaxPlot Results • 4238 proteins in 101 were compared in a 101xK12x0157 three way comparison • 1002 of the comparisons were equivalent for K12 and 0157 • 2120 of the comparisons had “better” scores for K12 • 523 of the comparisons had “better” scores for 0157 • You can click on any of the circles to get details of the specific gene(s)
Exercise 2, cont. • Go to the Tax Plot results for each of your two species • Compare and contrast the results for the two species • Are the genomes from one species more or less similar than the genomes for the second species? • Do the plots show high levels of synteny (the genes are in the same order or same place in the genomes)?
786 + 652 3823 X 100
100 % Proteome similarity Within Ec Ec Between Ec x Se Within Se Between Se x Ec 100 % Proteome similarity Se
DUE NEXT LABTaxplot results • What did taxplot tell you about the comparison of genomes within your two species? • What did taxplot tell you about the comparison of genomes between your two species? • How can we use these results to refine our study? Put in lab notebook
FROM LAST TIMEAlignments • You should have with you alignments produced by CLUSTALW for each of your proteins • Was CLUSTALW straightforward to use? • If not, why? • Did you have problems entering your data? • If yes, how did you solve them? • Did adjusting the gap and extension penalties help to improve your alignments? • If yes, which proteins? • Do you feel your alignments are the best they can be? • If yes, why? • If not, what should you do?
FROM LAST TIMEAlignments • Let’s look at your 12 alignment files • Print them out if you have not already done so • How well does each protein align within one species? • How does the alignment change when compared between two species? • Can we compare any of these proteins between all of our species (~30 species)?
FROM LAST TIMEAlignments • Please make sure that Peg or Michelle looks at your alignments and helps you to make them as robust as is possible • In some cases, we may choose to exclude a protein from analysis • In some cases, we may urge you to delete a taxa • In some cases, we may urge you to try more gap and/or extension penalty values • The goal for today is to finalize our alignments
FROM LAST TIMEAlignments • Your initial alignments are due today in class, please print them out and hand them in (they probably won’t be perfect, that is okay, we will work on them in class today) • Your finalized alignments are due on Thursday in class, please print them out and hand them in on Thursday