Download
1 / 47
470 likes | 551 Views
Introduction. Measurement of fraction of bottom quark pairs produced in the same hemisphere in f f towards Study uses sample where one bottom decays into a J/ Y and the other bottom decays into a SLT electron or CMUP muon

E N D
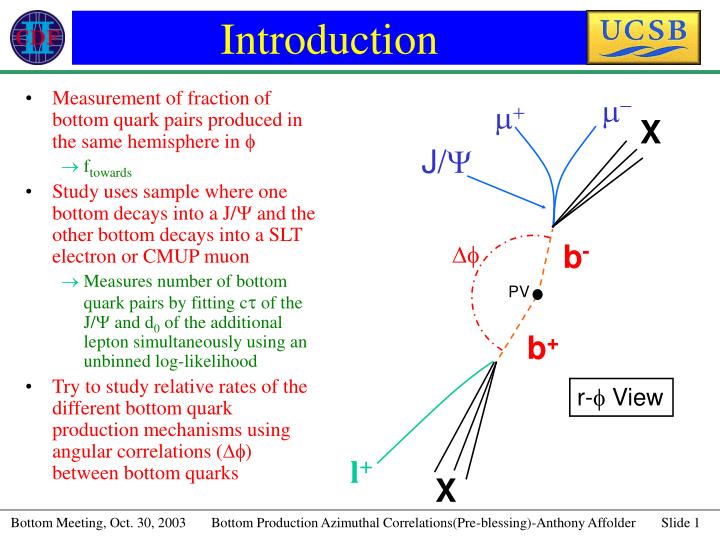
Introduction • Measurement of fraction of bottom quark pairs produced in the same hemisphere in f • ftowards • Study uses sample where one bottom decays into a J/Y and the other bottom decays into a SLT electron or CMUP muon • Measures number of bottom quark pairs by fitting ct of the J/Y and d0 of the additional lepton simultaneously using an unbinned log-likelihood • Try to study relative rates of the different bottom quark production mechanisms using angular correlations (Df) between bottom quarks m- m+ X J/Y b- Df PV b+ r-f View l+ X
BJ/Y K B0J/Y K0* Motivation (1) • Sin(2b) studies had large fraction of lepton flavor tags in same hemisphere as fully reconstructed bottom decays in the azimuthal angle. • Df not consistent with simulation • This study was undertaken to better understand location of flavor tags for Run II measurements
Motivation (2) • At low DF between the bottom quarks, gluon splitting and flavor excitation separate from flavor creation • No DF cutbetween J/Y andleptonnecessary • Only BcgJ/Y l X and bgJ/Y lfake X produce candidates from same bottom decay • Measurement of angular correlations can be used to tune leading-log generators • Pythia, Herwig, Isajet, …
Production Mechanisms • Bottom production proceeds through three categories of diagrams in perturbative calculations • Flavor creation • 2 bottom quarks final state in hard scatter (showering MC) • Flavor excitation • 1 bottom quark in initial and final state in hard scatter (showering MC) • Gluon splitting • No bottom quarks in initial or final state in hard scatter (showering MC) • Also known as shower/fragmentation • In showering Monte Carlos, mechanisms generated separately and added
Search for J/Y in low pT di-muon triggers Muons pass a trigger Muons pass pT requirement Varies with trigger Vertex c2 probability>1% Good c2 match of tracks to muon chambers c2 < 9 (r-f) c2 < 12 (r-z) Tight track quality Both stereo, axial hits in drift chamber (CTC) At least 3 of 4 silicon layers (SVX’) with hits 2.9< MJ/Y <3.2 Signal region |MPDG –MJ/Y|<50 MeV Sidebands 2.9< MJ/Y <3.0 3.1< MJ/Y <3.2 J/Y Selection
J/Y Candidates • 177650 pass selection • Fit with signal + sideband • Signal 2 G(x,s) • Sideband 1st order polynomial • 2nd order polynomial used as a systematic check of shape assumption • Rside=0.501 0.000043 (stat) 0.044 (syst) • Ratio of random track combinations in J/Y mass signal vs sideband region
SLT Electron Selection • Standard SLT electron selection except: • Sliding dE/dx cuts • Same as Bc discovery • Quality Track • Both stereo, axial hits in CTC • 3+ SVX hits • pT > 2 GeV/c • Conversion removal • 15 candidates vetoed in J/Y mass signal region • 312 candidates found in J/Y mass signal region • 107 Towards (Df<p/2) • 205 Away (Df>p/2) • 92 candidates found in J/Y mass sideband region • 45 Towards (Df<p/2) • 47 Away (Df>p/2) Black histograms-SLT electron candidates Yellow histograms-Conversion electrons
SLT Muon Selection • CMUP muon • Same c2 requirements as J/Y muon • Quality Track • Both stereo, axial hits in CTC • 3+ SVX hits • pT > 3 GeV/c • 142 candidates found in J/Y mass signal region • 64 Towards (Df<p/2) • 78 Away (Df>p/2) • 51 candidates found in J/Y mass sideband region • 34 Towards (Df<p/2) • 17 Away (Df>p/2) Black histograms-SLT CMUP muon candidates Yellow histograms-J/Y CMUP muons
Binned unbinned extended log-likelihood Bin data in J/Y mass(signal/sideband) and Df (towards/away) Inputs to the fit are the measured impact parameter of SLT lepton and ct of J/Y Fit uses impact parameter and lifetime templates in order to determine number of events from each source Fit includes external constraints Number of found conversion, estimated number of Bc events, etc. Constraints are in all capital letters, fit values in all in lower case Similar of Bc Discovery Fits CDF Note #3991 Fit described in CDF Note #6263 Fit Description
Fit Breaks Up Into 3 Components Global Constraints Ratios of residual/found conversions, sideband/signal region for J/Y background Bin Constraints Number of sideband, signal, conversion events measured Estimated number of Bc, bgJ/Y lfake X events Shape Impact parameter and ct distributions for each of the event sources Fit Description(2)
J/Y Bottom Decay Direct J/Y Sideband Additional Lepton Direct Fake Lepton Bottom Decay Includes sequential charm Candidate with J/Y candidate in mass sideband Conversions (electrons) Occurs when J/Y and leptons originate from the same displaced vertex BcgJ/Y l X bgJ/Y lfake X Event Sources Impact parameter and pseudo-ct correlated Impact parameter and pseudo-ct uncorrelated
Uncorrelated J/Y from bottom decay- Lepton from bottom decay (nbb) J/Y from bottom decay- Direct lepton (nbd) J/Y from bottom decay- Conversion electron Direct J/Y- Direct lepton (ndd) Direct J/Y- Conversion electron Events with J/Y candidate in mass sideband (nside) Direct J/Y- Lepton from bottom decay (ndb) is assumed to be small and set equal to zero. Correlated BcgJ/Y l X (nBc) bgJ/Y lfake X (nBfake) Event Sources (2)
J/Y ct Fit • Uncorrelated bottom and direct J/Y shapes determined by fit to entire Run 1B sample • CDF Note #5029 (R. Cropp) • Fit results • 22150270 Bottom • ctB=4425 mm • 16.60.2% Bottom • CDF Note #3460 (H. Wenzel, D. Benjamin) • 16.690.16% Bottom • ctB=452.44.6 mm • CDF Note #5029 (R. Cropp) • 17.620.16% Bottom • ctB=445.04.8 mm Sideband Signal
Template fit to Monte Carlos Pythia 5.6 using CTEQ3L PDF Generate flavor creation, flavor excitation, and gluon splitting separately. Combined in Monte Carlos predicted ratio. b or b forced to decay to J/Y Event selection J/Y DIMUTG pT same as data Quality tracks Vertex Probability >1% J/Y mass signal region Additional lepton requirements are same as data except: c2 requirement not applied to muons CPR, CES, CTC dE/dx efficiencies applied using measured efficiencies Bottom Impact Parameter Template
Bottom Impact Parameter Template • The combined sample is fit to a function to include in unbinned likelihood fit • Fits to individual mechanisms are very similar
Direct Impact Parameter Template • Direct template determined by Monte Carlos • Heavy flavor background in jet samples has similar size/shape to tail in impact parameter resolution function • Pythia 6.129+QFL’ • Lepton Fiducials • pT>3 GeV/c (muon) • pT>2 GeV/c (electron) • Quality Track • Monte Carlos fit to smooth function to include in unbinned log-likelihood fit
J/Y Sideband Templates Muon Electron • The impact parameter-ct shape used to describe events with J/Y in mass sidebands fit for using sideband data • ct and impact parameter fit independently • In electron sample, conversion component added to fit
Conversions vs. Bottom • Conversion candidates (with SVX hits) and electrons from bottom MC have very similar absolute impact parameter shapes • Signed impact parameter such that majority of conversion have positive impact parameter (see next slide) • Sign(C) d0
Conversion Sample (1) • Conversion found in J/Y sample are mostly positively signed • But large impact parameter tail and conversion radii outside of SVX layer 2 • How can 3 SVX hits be attached to theses tracks? • Large impact parameter yields a higher SVX search road • Higher false SVX hit attachment
Conversion Sample (2) • Effect can be seen in conversion radius vs. impact parameter plot • Conversion candidates have expected impact parameter-conversion radius relationship • Larger scatter at high conversion radius because at least one SVX hit mis-attached • Resolution closer to CTC only tracks
Conversion Impact Parameter Template • Construct conversion impact parameter template from Monte Carlos • Sample not large enough to measure from data directly • Candidates with at least 3 SVX Hits • Candidates with less than 3 SVX hits • Relative amount of each component set by distribution of conversion radius seen in data • Fraction of conversion candidates inside 6 cm in Monte Carlos matched to what is seen in data • Fraction of two components varied within statistical errors in data to estimate systematic uncertainty due to low number of found conversion found in J/Y dataset (>3 svx)
Conversion Impact Parameter Template Constructed shape describes conversion impact parameter shape remarkably well
Residual Conversion Estimates • Residual conversions assumed to be caused by inefficiency of tracking at low pT and of conversion finding algorithm • ecnv(pT) is tracking efficiency of softer conversion leg • ecnv(cut) is the efficiency of conversion selection criteria • Ratio of residual/found conversions (Rconv) is: Rconv = Pcnv • (1/ ecnv(pT)/ ecnv(cut) -1) • Pcnv is the purity of the conversions removed • Assumed to be 1.0 • Rconv=1.00±0.38 • Approximately 15 of 312 SLT electrons are conversions • Bc measurement had a Rconv of 1.06 ±0.36
Number of events with a bottom hadron decaying into a J/Y and a “fake” lepton Punch-thorough/decay-in-flight (Muons) Estimated using Bc analysis’ fake lepton rates and techniques Bgenerator(NDE)+QFL’ Details in CDF #5879 and #6263 Decay-in-flight 9.92.4 Using Bc Signal Cuts 6.01.3 Predicted 5.51.4 Bc Analysis Punch-through 1.760.88 Using Bc Signal Cuts 0.83 0.33 Predicted 0.880.35 Bc Analysis Fake electrons 2.850.75 Using Bc Signal Cuts 1.8 0.6 Predicted 2.60.3 Bc Analysis bJ/Y lFake Background (1)
bJ/Y lFake Background • Impact parameter-ct shape determined by fit to NDE Monte Carlo • Muons required to: • pT > 3 GeV • CMUP fiducial • CWUSWM • Quality Track • Electrons required to: • pT > 2 GeV • Electron fiducial • Quality Track
BC ct-Impact Parameter Template • Number of BcgJ/Y l X background (NBC) determined using published Bc cross section ratio and efficiencies and fit number of B+gJ/Y K+ • See CDF #5879 & # 6263 • NmBC=7.2+2.6-2.4 • NeBC=10.0+3.5-3.3 • All Bc in towards bin • Impact parameter-ct shape determined using Bc fragmention Monte Carlos + QFL’. • E. Braaten, et. al.
Fit Results (Muons) f mtowards=.345+0.092-0.082
Fit Results (Muons) CDF Preliminary (1994-1995)
Fit Results (Electrons) f etowards=.192+0.065-0.059
Fit Results (Electrons) CDF Preliminary (1994-1995) Constrained nbconv=0.20 ndconv (Ratio of J/Y from bottom/direct)
Toy Monte Carlos Studies (1) • 1000 Toy Monte Carlos samples made using assumed ct-impact parameter shapes and with similar numbers as data • Fitted results for all components has less than 0.1 (0.1) event bias and pulls of .95-1.08 (.94-1.05) for electrons (muons). • The fitted ftoward consistent with input value and width of distribution consistent with the error returned from the fit of data
Toy Monte Carlos Studies (2) • The fitted minimum of log-likelihood in data is also consistent with the distribution for the toy Monte Carlos assembles • Electron: 50% of trials have a larger likelihood than data • Muon: 20% of trials have a larger likelihood than data
Fit Systematics • Sequential fraction varied by ±19% • As in m-m and m-jet correlations papers • Bottom lifetimes varied by ±1s • LB fragmentation fraction varied by ±1s • Conversion shape varied • fback varied by ±1s and J/Y shapes refit • Fit re-done with Ndb0 • Ndconv=0 or Nbconv=0 and refit • Direct d0 shape parameter varied by ±1s and re-fit • As in Bc lifetime analysis
Correction of Data to Quark Level • To compare to theory predictions, the experimental measurement is corrected to the quark level • The pT and |y| in which 90% of Monte Carlos passing the selection criteria that have a smaller pT (higher |y|) is found • ftowards of the Monte Carlos is measured with/without the addition requirements • Ratio with/without cuts is the correction factor for B hadrons to partons • As in B rapidity correlations & m-m correlation measurements • The correction factor given by Monte Carlos combination of FC, FE, and GS is central value of correction used • Maximum difference for one production mechanism from the average is used to estimate the systematic uncertainty in correction • CeBb=0.967±0.019(stat)±0.088(syst) • CmBb=0.968±0.026(stat)±0.061(syst)
Theory Prediction • NLO QCD predictions is made with MNR • CTEQ5M and MRST99 used • mb is varied from 4.5-5.0 GeV • Renormalization scale is varied between 0.5-2.0 • Effects of large initial state transverse momenta made by varying <kT> between 0-4 GeV • Implied is the same method as diphoton (CDF #4726), m-b (CDF #3165), and m-m (CDF #3374)
Comparisons between PYTHIA/MNR (1) • Bottom quark pT and y (not shown) very similar in PYTHIA and NLO (MNR) • Three production mechanisms in PYTHIA also have very similar distributions
Comparisons between PYTHIA/MNR (2) • Bottom correlations in PYTHIA and NLO (MNR) look similar once a kT between 2-3 GeV is applied to NLO theory
Comparisons between PYTHIA/MNR (3) MNR normalized to total pythia • DF also matches between NLO and PYTHIA with a kT between 2-3 GeV
CDF Diphoton kT • Measured diphoton system pT is NOT consistent with NLO theory • Average system pT in range of 2-4 GeV. • Measurement is consistent with PYTHIA • Includes initial and final state radiation beyond NLO calculations
Final Results f corr,mtowards= 0.334 +0.089-0.079 +0.077-0.030 ±0.023 f corr,etowards= 0.186 +0.063-0.057 +0.005-0.006 ±0.017
Comparison to SECVTX-SECVTX f corr,mtowards= 0.334 +0.089-0.079 +0.077-0.030 ±0.023 f corr,etowards= 0.186 +0.063-0.057 +0.005-0.006 ±0.017 This Analysis • f corr,mtowards= 0.264 ±0.017±0.037 • f corr,etowards= 0.298 ±0.013±0.029 K. Lannon’s Analysis
Conclusions • ftowards measured is consistent with the NLO prediction (MNR) with a <kT> with a range between 0-3 GeV • Most consistent with 2 GeV • MNR with <kT>=4 GeV disagrees with the f etowards measurement at the 3 s level • The measured value of ftowards agrees with PYTHIA when combining all three bottom production mechanisms • PYTHIA flavor creation only disagrees with measurements by 3.4 s and 2.1 s for the muon and electron samples, respectively • Measured ftowards completely consistent with DF measured in BJ/Y K and B0J/Y K0* • PYTHIA and NLO kinematics agree once a <kT> =2-3 applied to the NLO prediction
ecnv(cut) Calculation • ecnv(cut) measured by loosening the conversion selection criteria and fitting the dE/dx of the additional conversion pair candidates • ecnv(cut)=72.3±6.5%
ecnv(pT)Calculation • ecnv(pT) calculated in manner similar to Bc analysis • Monte Carlos p0 matched to measured conversion pairs’ pT above 0.5 GeV where tracking is assumed to be fully efficient • ecnv(pT)=# of found conversion (data)/ # of conversions in MC (full pT range) • ecnv(pT)=69±5(stat)±9(syst)%
Normalization of BC Background • To normalize the Bc background, the number of B+J/Y K+ candidates in sample are fit • The kaon is required to: • Be in SLT electron fiduical region • pT > 2 GeV • 245±39 B+J/Y K+ candidates fit