Download
1 / 28
280 likes | 355 Views
Three Approaches to Value SAMA May 2012. What is happening in SK?. Cost Approach. Highlights

E N D
Cost Approach • Highlights • Historically, we have completed the Cost Approach in SAMA with all appraisers (80 to 100) but in order to make it a more efficient process we set up our procedures so all the Cost Analysis was completed by 20 Appraisers.
Cost Approach • We had fully documented procedures that were used by the Appraisers to take a Municipality from start to finish. • The project started in February 2012 and ended in December 2012. • Incorporated a ‘piecewise’ time adjustment instead of linear
Cost Approach • The existing stratifications were tested first and then consider other stratifications if necessary. • Approximately, 800 Municipalities were completed ranging from small hamlets to high valued Rural Municipalities
Cost Approach • Cost Analysts were located across the province in Regional offices so we had 2 forms of communication to deal with issues quickly • 1. ‘One on One’ meetings every week • 2. Weekly conference calls involving all Staff involved in the project
Residential Improvement Example • Population: 500 • Standard B class house with a basement, basement finish, attached garage, deck • 2012 improved value = $88 980 • 2013 improved value = $149 570
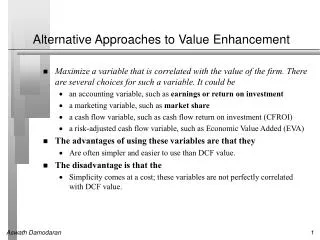
MRA • The MRA team developed a Global model for 9 Municipalities. This model helped us understand market relationships and price trends across a wide spectrum of sales. • A Guideline was developed to ensure consistency across market areas. • Also assists in handling features with no or few sales or that generates unexpected results often due to few sales.
MRA • After the Global model was developed one municipality was chosen to develop a market area model which became the starting point for the other market area models.
MRA • Three years of sales were used in all the MRA models (2008 -2010). • The following enhancements were made to the models that will be presented in 2013: • Addition of vacant land • Addition of rowhouse, townhouse, semidetached and mobile homes
Land value was determined by: • Example: Fully serviced lot • Land Size: 8160 SF X $3.14/SF = $25 692 • X Land Servicing (0) • X Neighbourhood (1.53) • X Abuts Apartment (1) • X Abuts Greenspace (1) • X Abuts Railway (1) • X Abuts Highway (0.95) • = $37,343
Improved value • Example: this is a one storey house, no basement, 3 car attached garage built in 2008
Improvement • Main living area: 1763 SF X $98.82/SF = $174 219 • PLUS Basement Area: 0 • Plus Basement Finish: 0 • Sum = $174 219 • X Construction Type (1) • Equals $174 219
Improvement • Attached Garage: 1128 SF X $42.82 = $48 300 • Deck: 192 SF X $18.57 = $3565 • Extra Plumbing: 4 X 1325 = $5300 • Sum: 48 300 + 3565 + 5300 = $57 165 • ($174,219 + $57,165) X 1.453 (Construction Quality) X 1.0 (Condition Rating) X 1.0 (Poor quality factor) = $ 336,201
Improvement • $336,201 + 4000 (A/C) = $340,201 • $340,201 X .98585 (age adjustment) X 1.0 (Building Neighbourhood Adjustment) X 1.0 (Abuts Highway) = $335,387 • MRA Land Value $37,343 • MRA Improvement Value $335,387 • MRA Total Value = $372,730 ($217 800)
INCOME APPROACH • General Commercial • Models were completed in 4 Cities and selected commercial properties in their surrounding Rural Municipalities
General Commercial • Base rents were calculated for each tenant with structural maintenance being accounted for • Rent stratification followed to derive the typical rents for a particular property type
General Commercial • Once the typical rents were complete then a non linear model structure was used to develop a rent table for the municipality • Time adjustment was also checked with a regression model • Vacancy analysis was completed • Capitalization rates were then calculated
Income – Multi Family • Multifamily models were created and applied Provincially in all SAMA jurisdictions • Average rents were calculated • Then the Effective Gross Income Multiplier was developed • Vacancy study was also conducted based on the vacancy reported by the property owners
Example: Average Quality 4 Plex • 2013 Revaluation • Suite Size Floor Location # of units Rent/Mo PGI • 1 BR Bsmt 1 $583 $ 6,996 • 2 BR Bsmt 1 $676 $ 8,112 • 2 BR Main 2 $689 $16,536 • Total 4 $31,644 • Market Vacancy 2.00% -$ 633 • Effective Gross Income $31,011 • EGIM 8.69 • EGI x EGIM = Value • $31,011 x 8.69 = $269,486 ($269,500) ($124 000)
Income-Limited Service Hotels • Calculate a weighted average daily rate (rack rate) • Occupancy is developed by weighted average daily rate and annual income from the rooms • Review expenses to develop the NOI • Review all allowable expenses • Stabilize expenses over the reporting period • Typical rate for rooms, occupancy, room expenses eg cleaning, supplies for the rooms and property expenses eg utilities, taxes, management, reserves for replacement • Combine all limited service and develop a model – develop a cap rate