Download
1 / 30
300 likes | 386 Views
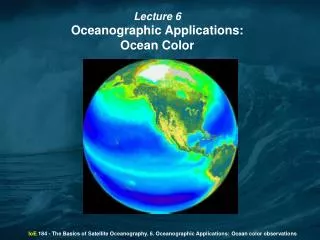
Cycling of Ocean Micronutrients: What do we Know and What do we Need to Know?. Ed Boyle Earth, Atmospheric and Planetary Sciences Massachusetts Institute of Technology Cambridge MA 02139 USA. Key Points I.

E N D
Cycling of Ocean Micronutrients: What do we Know and What do we Need to Know? Ed Boyle Earth, Atmospheric and Planetary Sciences Massachusetts Institute of Technology Cambridge MA 02139 USA
Key Points I • Fe, Cd, Zn (and other elements including Co) are required in important phytoplankton enzyme systems and features of their oceanic distributions show similarities with nutrients – typically showing low concentrations somewhere near the surface ocean and higher concentrations at depth. • Cd and Zn are incorporated into the shells of microfossils and have been enlisted for paleoceanographic purposes, so the importance of understanding them transcends their biogeochemical impact. • The distributions of these nutrient-like trace elements are more complicated than those of the major nutrients and the actual mechanisms governing uptake by microorganisms and regeneration back into the water column are poorly understood. • The oceanic distribution of Cd is most similar to that of P (or NO3-, if you take denitrification out of the equation), but there are significant changes to the Cd vs. P slope between surface and deep waters and between the ocean basins. Some field data and laboratory experiments imply that the Cd:P ratio varies with pCO2, raising questions about the future behavior of Cd in a high-CO2 world. There also is evidence that concentrations of Zn and Mn, and Fe limitation affect the Cd:P ratio of Southern Ocean phytoplankton assemblages. • The oceanic distribution of Zn is most similar to that of Si, but the reason for this similarity is not understood; the Zn:Si ratio of diatom frustules is much lower than the water column Zn:Si ratio and it seems more likely that Zn must be associated with some relatively refractory organic phase.
Key Points II • Despite extremely low concentrations in oligotrophic surface waters, it is not clear that Zn and Cd are limiting except for specific organisms. • Although it would be rash to say that organisms take up Cd and Zn without regard to their actual enzymatic needs, it also would be rash to ignore the possibility that they simply take up what is available (i.e., oceans with twice or half the Zn:C or Cd:C may be physiologically viable). • Fe is the clearest micronutrient in that its low concentrations limits phytoplankton growth in large parts of the ocean; it is likely that in these regions the Fe:C ratio of phytoplankton is close to the minimum necessary to support growth. The oceanic distribution of Fe is further complicated by atmospheric, coastal sediment, and hydrothermal inputs and by century-scale deepwater scavenging that drives the depletion of Fe in the ocean. • Another aspect of Fe that complicates our understanding compared to Cd or Zn is that while Cd and Zn are truly soluble (with organic and inorganic species), a significant fraction of Fe occurs in colloidal form.
Key Points III • Trace element sample collection is difficult because of contamination, as is analysis which is also complicated by the concentrated salt matrix. Data sets from before the mid-1970’s are generally incorrect, and data sets since then are still of variable quality.
Zn-Si relationship Bruland Zn-Si
Adding other data sets… Bruland + others Zn-Si
Average of data between 2800 and 4000m: 0.43 +/- 0.04 (1s s.d.) nmol/kg
Fe decreases as NADW moves from the North Atlantic into the South Atlantic: Scavenging Residence Time Estimate: North Atlantic Fe: 0.67 0.09 (9) South Atlantic Fe: 0.47 0.02 (7) Scavenging Residence Time: (based on Broecker C14 interpretation => 56 year transit time) 270 140 years
Tropical Atlantic Fe maximum occurs within the oxygen minimum O2 (ml/l) @ 250 dbar, recontoured from Fukimori and Wunsch
Note that N. Atl. O2 min. Fe has much higher Fe:P than other regions of the N. Atl. and N. Pac. Fe vs. P
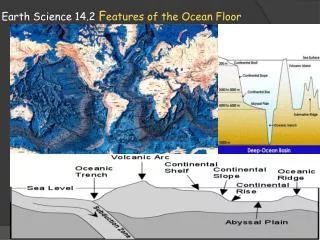
<0.02 um Fe is nearly constant in deep waters (0.2-0.4 nmol/kg). Most deep-sea Fe variability is due to changes in colloidal Fe.
<0.4 µm (DFe) vs 0.02-0.4 µm (CFe) Bergquist et al. (2007) Geochim. Cosmochim. Acta 71:2960
Key Points reprise I • The distributions of nutrient-like trace elements are more complicated than those of the major nutrients and the actual mechanisms governing uptake by microorganisms and regeneration back into the water column are poorly understood. • The oceanic distribution of Cd is most similar to that of P (or NO3-, if you take denitrification out of the equation), but there are significant changes to the Cd vs. P slope between surface and deep waters and between the ocean basins. Some field data and laboratory experiments imply that the Cd:P ratio varies with pCO2, raising questions about the future behavior of Cd in a high-CO2 world. There also is evidence that concentrations of Zn and Mn, and Fe limitation affect the Cd:P ratio of Southern Ocean phytoplankton assemblages. • The oceanic distribution of Zn is most similar to that of Si, but the reason for this similarity is not understood; the Zn:Si ratio of diatom frustules is much lower than the water column Zn:Si ratio and it seems that Zn must be associated with some relatively refractory organic phase.
Key Points Reprise II • Although it would be rash to say that organisms take up Cd and Zn without regard to their actual enzymatic needs, it also would be rash to ignore the possibility that they simply take up what is available (i.e., oceans with twice or half the Zn:C or Cd:C may be physiologically viable). • Fe is the clearest micronutrient in that its low concentrations limits phytoplankton growth in large parts of the ocean; it is likely that in these regions the Fe:C ratio of phytoplankton is close to the minimum necessary to support growth. Significant differences between the distribution of these metals and the major nutrients are seen between ocean basins and in the uppermost ocean. The oceanic distribution of Fe is further complicated by atmospheric, coastal sediment, and hydrothermal inputs and by century-scale deepwater scavenging that drives the depletion of Fe in the ocean. • Another aspect of Fe that complicates our understanding compared to Cd or Zn is that while Cd and Zn are truly soluble (with organic and inorganic species), a significant fraction of Fe occurs in colloidal form.
Cycling of Ocean Micronutrients: What do we Know and What do we Need to Know? Ed Boyle Earth, Atmospheric and Planetary Sciences Massachusetts Institute of Technology Cambridge MA 02139 USA