Download
1 / 1
10 likes | 137 Views
NACP. 14 th National Conference and Global Forum on Science, Policy and the Environment, January, 2014. Measuring CO 2 and CH 4 Emissions from Indianapolis: A Test Bed for Urban Greenhouse Gas Emissions Monitoring.

E N D
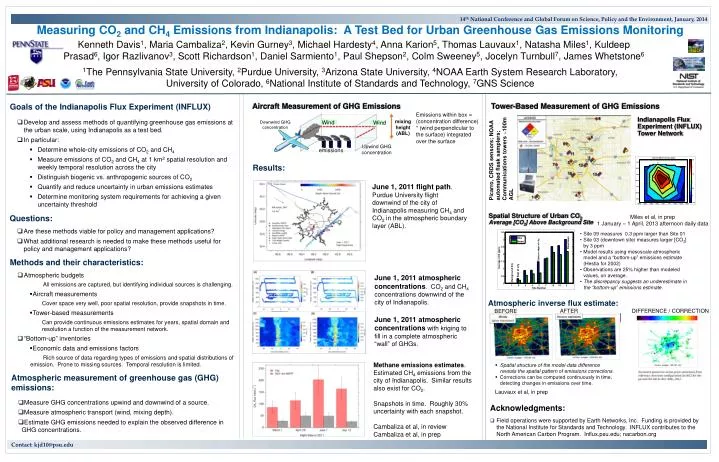
NACP 14th National Conference and Global Forum on Science, Policy and the Environment, January, 2014 Measuring CO2 and CH4 Emissions from Indianapolis: A Test Bed for Urban Greenhouse Gas Emissions Monitoring Kenneth Davis1, Maria Cambaliza2, Kevin Gurney3, Michael Hardesty4, Anna Karion5, Thomas Lauvaux1, Natasha Miles1, Kuldeep Prasad6, Igor Razlivanov3, Scott Richardson1, Daniel Sarmiento1, Paul Shepson2, Colm Sweeney5, Jocelyn Turnbull7, James Whetstone6 1The Pennsylvania State University, 2Purdue University, 3Arizona State University, 4NOAA Earth System Research Laboratory, University of Colorado, 6National Institute of Standards and Technology, 7GNS Science Aircraft Measurement of GHG Emissions Tower-Based Measurement of GHG Emissions Goals of the Indianapolis Flux Experiment (INFLUX) Emissions within box = (concentration difference) * (wind perpendicular to the surface) integrated over the surface Picarro, CRDS sensors; NOAA automated flask samplers; Communications towers ~100m AGL Indianapolis Flux Experiment (INFLUX) Tower Network • Develop and assess methods of quantifying greenhouse gas emissions at the urban scale, using Indianapolis as a test bed. • In particular: • Determine whole-city emissions of CO2 and CH4 • Measure emissions of CO2 and CH4 at 1 km2 spatial resolution and weekly temporal resolution across the city • Distinguish biogenic vs. anthropogenic sources of CO2 • Quantify and reduce uncertainty in urban emissions estimates • Determine monitoring system requirements for achieving a given uncertainty threshold mixing height (ABL) Wind Wind Downwind GHG concentration Upwind GHG concentration emissions 38 Results: 2 June 1, 2011 flight path. Purdue University flight downwind of the city of Indianapolis measuring CH4 and CO2 in the atmospheric boundary layer (ABL). 6 Spatial Structure of Urban CO2Average [CO2] Above Background Site Questions: 20 Miles et al, in prep 1 January – 1 April, 2013 afternoon daily data • Are these methods viable for policy and management applications? • What additional research is needed to make these methods useful for policy and management applications? • Site 09 measures 0.3 ppm larger than Site 01 • Site 03 (downtown site) measures larger [CO2] by 3 ppm • Model results using mesoscale atmospheric model and a “bottom-up” emissions estimate (Hestia for 2002) • Observations are 25% higher than modeled values, on average. • The discrepancy suggests an underestimate in the “bottom-up” emissions estimate. Downtown Eastern edge of city Methods and their characteristics: East of city • Atmospheric budgets • All emissions are captured, but identifying individual sources is challenging. • Aircraft measurements • Cover space very well, poor spatial resolution, provide snapshots in time. • Tower-based measurements • Can provide continuous emissions estimates for years, spatial domain and resolution a function of the measurement network. • “Bottom-up” inventories • Economic data and emissions factors • Rich source of data regarding types of emissions and spatial distributions of emission. Prone to missing sources. Temporal resolution is limited. June 1, 2011 atmospheric concentrations. CO2 and CH4 concentrations downwind of the city of Indianapolis. Atmospheric inverse flux estimate: AFTER DIFFERENCE / CORRECTION BEFORE June 1, 2011 atmospheric concentrations with kriging to fill in a complete atmospheric “wall” of GHGs. Methane emissions estimates. Estimated CH4 emissions from the city of Indianapolis. Similar results also exist for CO2. Snapshots in time. Roughly 30% uncertainty with each snapshot. Cambaliza et al, in review Cambaliza et al, in prep • Spatial structure of the model-data difference reveals the spatial pattern of emissions corrections. • Corrections can be computed continuously in time, detecting changes in emissions over time. Atmospheric measurement of greenhouse gas (GHG) emissions: Lauvaux et al, in prep • Measure GHG concentrations upwind and downwind of a source. • Measure atmospheric transport (wind, mixing depth). • Estimate GHG emissions needed to explain the observed difference in GHG concentrations. Acknowledgments: • Field operations were supported by Earth Networks, Inc. Funding is provided by the National Institute for Standards and Technology. INFLUX contributes to the North American Carbon Program. Influx.psu.edu; nacarbon.org Contact: kjd10@psu.edu