Download
1 / 1
10 likes | 167 Views
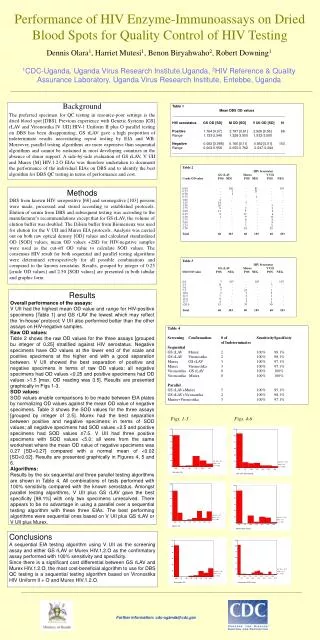
Conclusions A sequential EIA testing algorithm using V UII as the screening assay and either GS rLAV or Murex HIV.1.2.O as the confirmatory assay performed with 100% sensitivity and specificity.

E N D
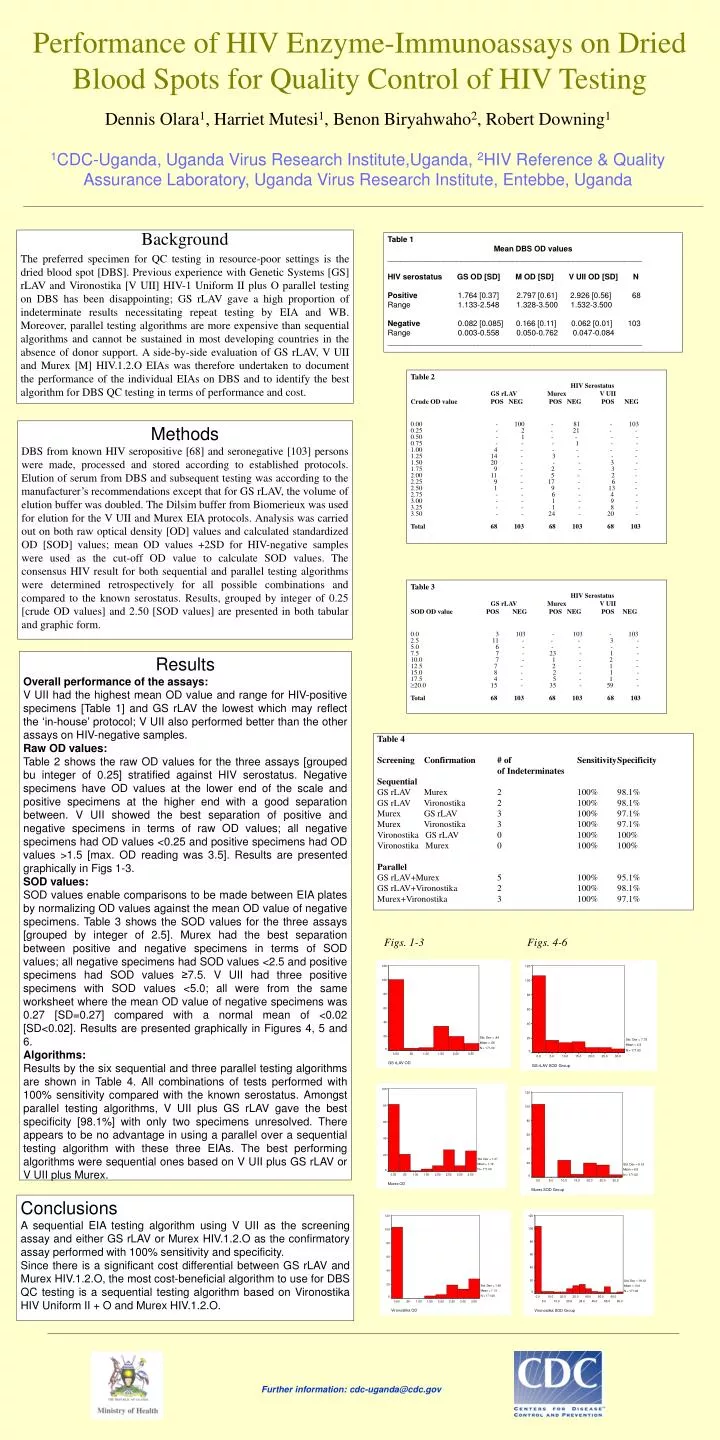
Conclusions A sequential EIA testing algorithm using V UII as the screening assay and either GS rLAV or Murex HIV.1.2.O as the confirmatory assay performed with 100% sensitivity and specificity. Since there is a significant cost differential between GS rLAV and Murex HIV.1.2.O, the most cost-beneficial algorithm to use for DBS QC testing is a sequential testing algorithm based on Vironostika HIV Uniform II + O and Murex HIV.1.2.O. Table 1 Mean DBS OD values ___________________________________________________________ HIV serostatus GS OD [SD] M OD [SD] V UII OD [SD] N Positive 1.764 [0.37] 2.797 [0.61] 2.926 [0.56] 68 Range 1.133-2.548 1.328-3.500 1.532-3.500 Negative 0.082 [0.085] 0.166 [0.11] 0.062 [0.01] 103 Range 0.003-0.558 0.050-0.762 0.047-0.084 ___________________________________________________________ Methods DBS from known HIV seropositive [68] and seronegative [103] persons were made, processed and stored according to established protocols. Elution of serum from DBS and subsequent testing was according to the manufacturer’s recommendations except that for GS rLAV, the volume of elution buffer was doubled. The Dilsim buffer from Biomerieux was used for elution for the V UII and Murex EIA protocols. Analysis was carried out on both raw optical density [OD] values and calculated standardized OD [SOD] values; mean OD values +2SD for HIV-negative samples were used as the cut-off OD value to calculate SOD values. The consensus HIV result for both sequential and parallel testing algorithms were determined retrospectively for all possible combinations and compared to the known serostatus. Results, grouped by integer of 0.25 [crude OD values] and 2.50 [SOD values] are presented in both tabular and graphic form. Results Overall performance of the assays: V UII had the highest mean OD value and range for HIV-positive specimens [Table 1] and GS rLAV the lowest which may reflect the ‘in-house’ protocol; V UII also performed better than the other assays on HIV-negative samples. Raw OD values: Table 2 shows the raw OD values for the three assays [grouped bu integer of 0.25] stratified against HIV serostatus. Negative specimens have OD values at the lower end of the scale and positive specimens at the higher end with a good separation between. V UII showed the best separation of positive and negative specimens in terms of raw OD values; all negative specimens had OD values <0.25 and positive specimens had OD values >1.5 [max. OD reading was 3.5]. Results are presented graphically in Figs 1-3. SOD values: SOD values enable comparisons to be made between EIA plates by normalizing OD values against the mean OD value of negative specimens. Table 3 shows the SOD values for the three assays [grouped by integer of 2.5]. Murex had the best separation between positive and negative specimens in terms of SOD values; all negative specimens had SOD values <2.5 and positive specimens had SOD values ≥7.5. V UII had three positive specimens with SOD values <5.0; all were from the same worksheet where the mean OD value of negative specimens was 0.27 [SD=0.27] compared with a normal mean of <0.02 [SD<0.02]. Results are presented graphically in Figures 4, 5 and 6. Algorithms: Results by the six sequential and three parallel testing algorithms are shown in Table 4. All combinations of tests performed with 100% sensitivity compared with the known serostatus. Amongst parallel testing algorithms, V UII plus GS rLAV gave the best specificity [98.1%] with only two specimens unresolved. There appears to be no advantage in using a parallel over a sequential testing algorithm with these three EIAs. The best performing algorithms were sequential ones based on V UII plus GS rLAV or V UII plus Murex. Performance of HIV Enzyme-Immunoassays on Dried Blood Spots for Quality Control of HIV Testing Dennis Olara1, Harriet Mutesi1, Benon Biryahwaho2, Robert Downing1 1CDC-Uganda, Uganda Virus Research Institute,Uganda, 2HIV Reference & Quality Assurance Laboratory, Uganda Virus Research Institute, Entebbe, Uganda Background The preferred specimen for QC testing in resource-poor settings is the dried blood spot [DBS]. Previous experience with Genetic Systems [GS] rLAV and Vironostika [V UII] HIV-1 Uniform II plus O parallel testing on DBS has been disappointing; GS rLAV gave a high proportion of indeterminate results necessitating repeat testing by EIA and WB. Moreover, parallel testing algorithms are more expensive than sequential algorithms and cannot be sustained in most developing countries in the absence of donor support. A side-by-side evaluation of GS rLAV, V UII and Murex [M] HIV.1.2.O EIAs was therefore undertaken to document the performance of the individual EIAs on DBS and to identify the best algorithm for DBS QC testing in terms of performance and cost. Table 2 HIV Serostatus GS rLAV Murex V UII Crude OD value POS NEG POS NEG POS NEG 0.00 - 100 - 81 - 103 0.25 - 2 - 21 - - 0.50 - 1 - - - - 0.75 - - - 1 - - 1.00 4 - - - - - 1.25 14 - 3 - - - 1.50 20 - - - 3 - 1.75 9 - 2 - 3 - 2.00 11 - 5 - 2 - 2.25 9 - 17 - 6 - 2.50 1 - 9 - 13 - 2.75 - - 6 - 4 - 3.00 - - 1 - 9 - 3.25 - - 1 - 8 - 3.50 - - 24 - 20 - Total 68 103 68 103 68 103 Table 3 HIV Serostatus GS rLAV Murex V UII SOD OD value POS NEG POS NEG POS NEG 0.0 3 103 - 103 - 103 2.5 11 - - - 3 - 5.0 6 - - - - - 7.5 7 - 23 - 1 - 10.0 7 - 1 - 2 - 12.5 7 - 2 - 1 - 15.0 8 - 2 - 1 - 17.5 4 - 5 - 1 - ≥20.0 15 - 35 - 59 - Total 68 103 68 103 68 103 Table 4 Screening Confirmation # of Sensitivity Specificity of Indeterminates Sequential GS rLAV Murex 2 100% 98.1% GS rLAV Vironostika 2 100% 98.1% Murex GS rLAV 3 100% 97.1% Murex Vironostika 3 100% 97.1% Vironostika GS rLAV 0 100% 100% Vironostika Murex 0 100% 100% Parallel GS rLAV+Murex 5 100% 95.1% GS rLAV+Vironostika 2 100% 98.1% Murex+Vironostika 3 100% 97.1% Figs. 1-3 Figs. 4-6 Further information: cdc-uganda@cdc.gov