Download
1 / 18
180 likes | 437 Views
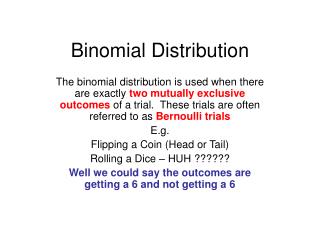
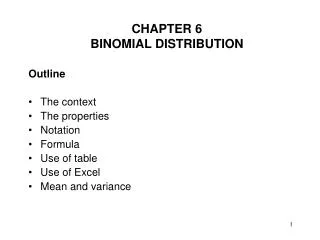
CHAPTER 6 BINOMIAL DISTRIBUTION. Outline The context The properties Notation Formula Use of table Use of Excel Mean and variance. BINOMIAL DISTRIBUTION THE CONTEXT. An important property of the binomial distribution:

E N D
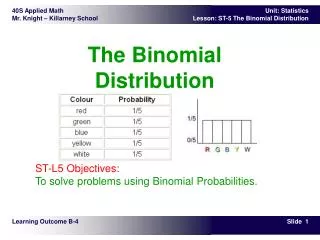
CHAPTER 6BINOMIAL DISTRIBUTION Outline • The context • The properties • Notation • Formula • Use of table • Use of Excel • Mean and variance
BINOMIAL DISTRIBUTIONTHE CONTEXT • An important property of the binomial distribution: • An outcome of an experiment is classified into one of two mutually exclusive categories - success or failure. • Example: Suppose that a production lot contains 100 items. The producer and a buyer agree that if at most 2 out of a sample of 10 items are defective, then all the remaining 90 items in the production lot will be purchased without further testing. Note that each item can be defective or non defective which are two mutually exclusive outcomes of testing. Given the probability that an item is defective, what is the probability that the 90 items will be purchased without further testing?
BINOMIAL DISTRIBUTIONTHE CONTEXT TrialTwo Mut. Excl. and exhaustive outcomes Flip a coin Head / Tail Apply for a job Get the job / not get the job Answer a Multiple Correct / Incorrect choice question
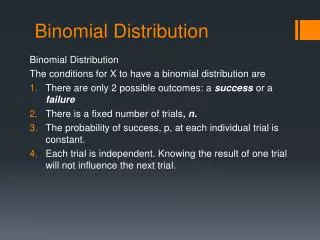
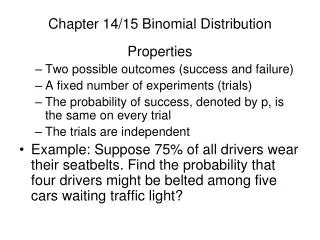
BINOMIAL DISTRIBUTIONTHE PROPERTIES • The binomial distribution has the following properties: 1. The experiment consists of a finite number of trials. The number of trials is denoted by n. 2. An outcome of an experiment is classified into one of two mutually exclusive categories - success or failure. 3. The probability of success stays the same for each trial. The probability of success is denoted by p. 4. The trials are independent.
BINOMIAL DISTRIBUTIONTHE NOTATION • Notation • n : the number of trials • x : the number of observed successes • p : the probability of success on each trial • q : the probability of failure on each trial • Note: • Since success and failure are two mutually exclusive and exhaustive events p+ q=1 p=1- q q=1- p
BINOMIAL DISTRIBUTIONTHE PROBABILITY DISTRIBUTION • The binomial probability distribution gives the probability of getting exactly x successes out of a total of n trials. • The probability of getting exactly x successes out of a total of n trials is as follows: • Note: In the above gives the number of different ways of choosing x objects out of a total of n objects
BINOMIAL DISTRIBUTIONTHE PROBABILITY DISTRIBUTION Example 1: If you toss a fair coin twice, what is the probability of getting one head and one tail? From our previous discussion, we know that the answer is 0.50. Verify if the binomial probability distribution formula gives the same answer.
BINOMIAL DISTRIBUTIONTHE PROBABILITY DISTRIBUTION Example 2: If you toss a fair coin three times, what is the probability of getting at most one head (at least two tails)?
BINOMIAL DISTRIBUTIONTHE PROBABILITY DISTRIBUTION Example 3 (self study): Redo Example 2 with a probability tree and verify if the probability tree gives the same answer.
BINOMIAL DISTRIBUTIONNECESSITY OF A TABLE OR SOFTWARE Example 4 (do not solve): If you toss a fair coin 25 times, what is the probability of getting at most 10 heads (at least 15 tails)? Do not solve this problem, but discuss the computation required by the binomial probability distribution formula.
BINOMIAL DISTRIBUTIONUSE OF TABLE • Table 1, Appendix B, pp. 830-834 gives the probability of getting at mostk successes out of a total of n trials, for probability of success in each trial p. • The table does not include the cases where k=n. The probability of getting at mostn successes out of a total of n trials is 1.00 - so, if k=n, the required probability is 1.00 • The table can be used to find the probability of • exactly k successes: • at least k successes: • successes between a and b:
BINOMIAL DISTRIBUTIONUSE OF TABLE Example 5: Find the following using Table 1: Example 6: Find the following: Example 7: Find the following using Table 1:
BINOMIAL DISTRIBUTIONUSE OF TABLE Example 8 (self study): If you toss a fair coin 25 times, what is the probability of getting at most 10 heads (at least 15 tails)? Solve this problem using the Table 1.
BINOMIAL DISTRIBUTIONUSE OF EXCEL • The Excel function BINOMDIST gives and • It takes four arguments. The first 3 arguments are k,n,p • The last one is TRUE for and FALSE for Example 9 (self study): If you toss a fair coin 25 times, what is the probability of getting at most 10 heads (at least 15 tails)? Solve this problem using Excel. Verify if Excel gives the same answer as it is given by Table 1 in Example 8. Answer: =BINOMDIST(10,25,0.5,TRUE)
BINOMIAL DISTRIBUTIONMEAN AND VARIANCE • If X is a binomial random variable, the mean and the variance of Xare: • E(X) is the mean or expected value of X • V(X) is the variance of X • n is the number of trials • p is the probability of success on each trial • q is the probability of failure on each trial = 1-p
BINOMIAL DISTRIBUTIONMEAN AND VARIANCE Example 10: Let Xbe a random variable that gives number of heads when a fair coin is tossed 4 times. Compute E(X) and V(X). The interpretation of E(X) and V(X) is done in Example 11.
BINOMIAL DISTRIBUTIONMEAN AND VARIANCE Example 11: 5 volunteers are needed for this problem. Each volunteer will toss a fair coin 4 times and record the number of heads. Example 12: Find mean and (population) variance of 5 (random) numbers generated in Example 11 and verify if the mean and variance are nearly same as E(X) and V(X) computed in Example 10.
READING AND EXERCISES • Reading: pp. 225-234 • Exercises: 6.68, 6.70a, 6.74, 6.78