Download
1 / 36
360 likes | 663 Views
Response rates and potential selection bias in academic business surveys Tony Hak RSM Erasmus University Rotterdam The Netherlands thak@rsm.nl Background High quality of establishment surveys conducted by government institutions

E N D
Response rates and potential selection bias in academic business surveysTony HakRSM Erasmus UniversityRotterdamThe Netherlandsthak@rsm.nl
Background • High quality of establishment surveys conducted by government institutions • Bewilderment about quality of surveys in academic business research Academic business surveys
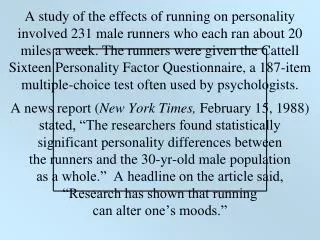
Example Yehuda Baruch (1999), “Response rates in academic studies – A comparative analysis”, Human Relations, 52(4) • Average response rate 55.6% with a standard deviation of 19.7 • “It is suggested that the average found in this study should be used as a norm for future studies” Academic business surveys
Aims • Problem identification: Is there a problem regarding the quality of academic business surveys? • Diagnosis: Can the problem be explained by differences between academic surveys and government surveys? • Solutions: What can be done? Academic business surveys
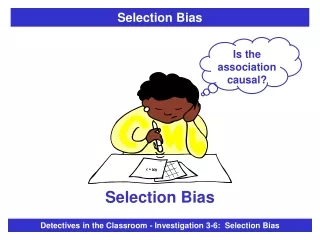
Problem identification • Top best publications Academy of Management Journal (AMJ) • Current situation most recent volume (volume 49, 2006) • Focus on selection bias (coverage, sampling and response) Academic business surveys
Method • Select surveys • Select business surveys • Describe • Response rates • Justification for achieved response rates • Discussion of potential selection bias Academic business surveys
Non-surveys From 59 research papers: Clearly not a survey 19 • Qualitative research 8 • Experimental research 6 • Meta-analysis 3 • Simulation 2 Possibly a survey 40 Academic business surveys
What is a survey? There are 23 studies (out of 40) in which propositions are tested in populations for which data were collected from data bases or information systems but that in all other respects were similar to surveys for which data were collected by sending a questionnaire to the company or by asking informants questions in telephone interviews Academic business surveys
Example Burger King (1) Example: A survey of Burger King restaurants using the POS system installed in each restaurant If using data from the POS system would not have been feasible, questionnaires could have been sent to the restaurant managers Academic business surveys
Example Burger King (2) Advantages of using data from POS rather than using a questionnaire: • No non-response • Maximum reliability of data • Validity of data depends on POS, not on the response process Academic business surveys
But is it a survey? Groves et al. (2004: 2): “a systematic method for gathering information from (a sample of) entities for the purposes of constructing quantitative descriptors of the attributes of the larger population of which the entities are members” Academic business surveys
Definition of a survey A survey must be defined by the aim of constructing quantitative descriptors of a population, not by its method of data collection The use of a standardized questionnaire is not a defining characteristic of a survey Academic business surveys
Examples of surveys without a questionnaire • A survey of plants in polluting industries in the USA using data from TRI reports filed by these plants • A survey of TQM consulting firms using data from Kennedy Information (a specialized firm that produces industry reports) • A survey of acquisitions using data from COMPUSTAT • A survey of US subsidiaries of foreign banks using the Call reports database Academic business surveys
Aims and populations • The aim of all these studies is theory-testing • Selection of population is relatively arbitrary • Availability of data might be a criterion for population selection • Representativeness of the available data might be a criterion for population selection Academic business surveys
Domain and population x x x x x x x x x x x x x x x x xx x x x x x x xx x x x x x x x x x x x xx x x x xxx xx x x x x x xx x x xx x x x x x x x x xx x xx x x x x xxx x x x x x x x x xx x x x x x xxx x x x xx x x x xxx x x x x x x x x x x x x x xx x x x x x x x x x xx x x x x x x xx x x xxx xxxx xxx xx xx xx xxx xx xxxxx xxxx xx x xx xxxx xx xx x xx x xx xxx xxx xxxx x x x x x x x x x xx xx xx x x x x xx x x x x x x x xxxx x xxx x x x x x x x x x x xxx xx x x xx x x x x x x xx xx x xx x x x xxxxx xx x x x x x xxxx x x x x xxx x xx x xx xxx Academic business surveys
Replication • Each survey is only one test of the theory • A theory is robust if it is shown to be true in repeated tests in different parts of a domain • Increasing the robustness of a theory requires replication, i.e. the purposive selection of next populations for testing Academic business surveys
Population selection (1) • Selection of a population from a domain is not a form of sampling because • The aim is replication, not representativeness • There is no sampling frame • No discussion in textbooks Academic business surveys
Population selection (2) • Population selection might take data collection problems into account • Response and data error is minimized if a population is selected that is small and/or for which data can be collected from information systems Academic business surveys
Methods of data collection in AMJ surveys From 40 surveys in Volume 49 (2006) of AMJ: • 23 use data from data bases or information systems quality and representativeness of data dependent on data base or system • 17 use questionnaires quality and representativeness of data dependent on response process Academic business surveys
Different types of population • Populations range from persons (e.g., teachers or workers) and teams of persons to organizations and their activities or characteristics (e.g., alliances) • I focus in this presentation for ICES on surveys of organizations only Academic business surveys
Questionnaire surveys From 17 surveys with questionnaires: • One uses data from a government survey • Eleven are surveys of persons or (generic) teams, not of organizations • Five are similar to establishment surveys Academic business surveys
Five business surveys • A survey of technology companies using data partially collected with standardized questionnaires from HRM managers and “core knowledge workers” • A survey of US corporations using data collected from CEOs and their top management team members • A survey of private companies using data collected from “executives” • A survey of interorganizational relationships involving R&D using data collected from managers • A survey of international strategic alliances operating in India using data collected from managing directors and CEOs Academic business surveys
Survey 1 • Theory: The effect of HRM practices on performance • Population: All 397 companies on a list compiled by the researchers from two business publications • Sample: Not applicable (census) • Participation rate of firms: 136 of 397 (34%) • Information on non-participation error: “Participating organizations did not differ from nonparticipating firms in reported sales or number of employees” • Response rate of knowledge workers in 136 firms: 61% • Information on non-response error: None • Discussion of limitations: None Academic business surveys
Survey 2 • Theory: The effect of leadership on performance • Population: All companies in the Financial 1000 and Corporate 1000 Yellow Books • Sample: Random sample of 500 CEOs • Participation rate of CEOs: 128 of 500 (26%) • Information on non-participation error: “We compared our sample (sic) with the nonresponding firms. The t-tests demonstrated no significant differences” • Response rate in 128 firms: 80% • Information on non-response error: None • Discussion of limitations: “Our sample might be overly populated with CEOs with specific characteristics“ Academic business surveys
Survey 3 • Theory: Determinants of executive compensation • Population: All companies on a list compiled by three American professional services firms • Sample: Not applicable (census) • Response rate: 20% “[This is] relatively high, considering the sensitivity of the questions and the level of the executives targeted” • Information on non-response error: “No statistical significant differences were observed between respondents and nonrespondents on these dimensions” • Discussion of limitations: None Academic business surveys
Survey 4 • Theory: The effectiveness of types of contracts in constraining opportunism • Population: All Indian firms with specific SIC codes • Sample: Random sample of 2600 managers • Response rate: 22% • Information on non-response error: “No significant differences were found between early and late responders. We also compared responding with nonresponding firms on primary three-digit SIC code; this identifier failed to significantly predict response” • Discussion of limitations: “It is a study of 125 firms, so replication is needed” Academic business surveys
Survey 5 • Theory: The effect of uncertainty on alliances • Population: All strategic alliances on the member lists of various international chambers of commerce in India • Sample: “We identified a sample of 700 dyadic international strategic alliances operating in India” • Response rate: 126 of 700 (18%). • Information on non-response error: “The results of the t-tests for the sizes of the firms and the age of the local firm revealed no significant differences between respondent and non-respondent groups. We found no difference between early and late respondents.” • Discussion of limitations: None Academic business surveys
Summary • Aims: Theory-testing • Selection of population: • No discussion of relevance for replication • No discussion of implications for data collection methods • Response rates: 18-34%, presented as “normal” or “relatively high” • Information on non-response error: • Comparison of respondents and non-respondents on known characteristics in all studies • Comparison of early and late respondents in two studies • Discussion of limitations: Some Academic business surveys
Comments • Response rates very low • No serious attempt to assess extent of selection bias • Studies would not be released by government institutions because of potential selection bias Academic business surveys
Problem identification Two types of academic surveys: • Surveys that use data from data bases or information systems no selection bias in study itself, but might exist in data base • Surveys that use data collected by questionnaires huge potential selection bias; no awareness or the problem Academic business surveys
Response process model as a diagnostic tool • Encoding in memory / record formation • Respondent selection and identification • Assessment of priorities • Comprehension of the data request • Retrieval of information • Judgment of adequacy of response • Communication of the response • Release of the data Academic business surveys
Diagnosis • Authors mention problems of accessing and motivating respondents: insufficient incentives for participation • No particular problems regarding question comprehension, data retrieval or authorization Academic business surveys
Solutions? • It is very unlikely that response rates in business surveys using questionnaires can be increased to a sufficient extent. If possible at all, solutions are too costly • Solutions can only be found by using other data sources and other methods of data collection. This implies the selection of other populations Academic business surveys
Conclusions • Theory-testing business surveys that require data collection with questionnaires are not feasible • Theory-testing does not require data collection with questionnaires • Critical issue: selection of the population to be surveyed (replication strategy) Academic business surveys
Discussion (1) “Ideal” survey populations for testing (probabilistic) propositions • Are small • Consist of members that are easily accessible for researchers (for direct data extraction), or • Feed relevant data into information systems Academic business surveys
Discussion (2) Identifying and selecting such “ideal” survey populations for theory-testing is possible, but requires that such selection is a conscious process steered by an explicit replication strategy Academic business surveys