Download

1 / 32
320 likes | 630 Views
IPCC Extremes-SR Scoping Meeting, 23 March 2009, Oslo, Norway Projection of Changes in Extremes by Very High Resolution Atmospheric Models Akio KITOH Meteorological Research Institute, Tsukuba, Japan Precipitation changes IPCC AR4 CMIP3 models White: <2/3 of models agree on sign of change

E N D
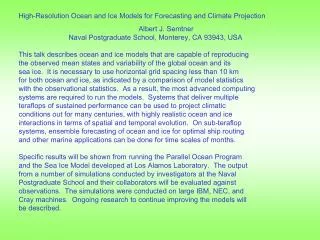
IPCC Extremes-SR Scoping Meeting, 23 March 2009, Oslo, Norway Projection of Changes in Extremes by Very High Resolution Atmospheric Models Akio KITOH Meteorological Research Institute, Tsukuba, Japan
Precipitation changes IPCC AR4 CMIP3 models White: <2/3 of models agree on sign of change Stippled: >90% of models agree on sign of change Precipitation increasesvery likely in high latitudes Decreaseslikely in most subtropical land regions Model agreement is not so high in other regions
IPCC AR4 CMIP3 models Projected changes in extremes Intensity of precipitation events is projected to increase. Even in areas where mean precipitation decreases, precipitation intensity is projected to increase but there would be longer periods between rainfall events. “It rains less frequently, but when it does rain, there is more precipitation for a given event.” (Tebaldi et al. 2006) Extremes will have more impact than changes in mean climate
CMIP3 models Frequency Intensity All precip Light precip 1-10 mm/d Heavy precip 20-50 mm/d Sun et al. (2007) JCLI
CMIP3 models 20-yr return values of 24-h precipitation 20-yr return values of annual extremes of 24-h precipitation rates (P20) •Global average P20 increases about 6%/K of global warming, with the range of 4%/K-10%/K •Large inter-model differences in precipitation extremes Waiting times for P20 Kharin et al. (2007) JCLI
Needs for high resolution models• representation of topography depends on resolution (land-sea distribution, mountain height, snow-rain threshold, …)• low resolution models often fail to reproduce precipitation systems such as tropical cyclones, stationary front systems and blocking• high resolution models have better mean climate
Indian summer monsoon rainfall IMD observation 20-km model Orographic rainfall is successfully reproduced Rajendran and Kitoh (2008) Current Science
Typhoon track and intensity: 60km vs 20km In forecast mode JMA 60km mesh model 20km mesh model 60-km model forecasts shallower central pressures and weaker maximum winds. 20-km model represents typhoon development closer to the observations. NWP from Nov 2007 at JMA
Comparison of extremes indices between observation and each resolution models MRI AGCM pav wetday r5d cdd obs(GPCP1DD) 1deg(100km) model TL63(270km) model TL95(180km) model TL959(20km) • pav: Annual mean precipitation (mm/day) • wetday: Number of days (> 1 mm/day) • r5d: The annual maximum 5-day total precipitation • cdd: The annual maximum consecutive dry-days more wetday in low-res model better Typhoons/Baiu in high-res model more bias in low-res model
There are now some high-resolution modeling results available for climate change projections • Regional climate model PRUDENCE, ENSEMBLES, NARCCAP other regions followmulti-model butregional (can apply to other regions)• Stretched-grid model CCAM, GEM, ARPEGE, GEOS• Super-high resolution models (=NWP model) MRI/JMA 20-km mesh AGCM + 5-km RCRCMglobal butsingle-model (can apply physics/b.c. ensemble)
PRUDENCE Daily summer temperature Over France, at least every second and third summer day exceeds the 95th percentile, and a considerable number of days even the maximum values of the present Fischer and Schär (2009) ClimDyn
Example by global 20-km mesh AGCM • tropical cyclone • extratropical cyclone • blocking
Kakushin Team-Extremes Time-Slice Experiments Boundary condition Atmosphere SST CMIP3 AOGCMs 20km,60km AGCM 5km,2km,1km RCM Projected SST Atmosphere SST AGCM/RCM is a climate model version of the JMA operational NWP models Lower B.C. Ocean • Present-day climate experiment (1979-2003) • the observed sea surface temperature (SST) and sea-ice concentration • Future climate experiment (2075-2099) • the warming in the SST for the CMIP3 multi-model ensemble mean is added to the observed SST Mizuta et al. (2008)
Inter-annual variability of TC frequency Observation 20-km AGCM (AMIP run 1979-2003) 0.04 0.17 0.55### 0.53### 0.35# 0.48## 0.17 ###:99% significance level ##:95% significance level #:90% significance level There is a skill for TC frequency interannual variability associated with ENSO
Number of TC Generated in Each Latitude Annual global average Present =82 Future =66 20% decrease (Observation:84) Observation (20% decrease) Present-day(25yr) Future(25yr) TC freqency Latitude
Observation Present Experiment Future Experiment Change in TC intensity and duration Intensity Duration when wind speed is over 17m/s Longer lived TCs will increase Stronger TCs will increase
Radial Profile Change around TC Precipitation Surface Wind Present Experiment Future Experiment Change rate Radial Distance in km from Storm Center ・Large changes occur near inner-coreregion, 40-60% for precipitation and 15-20% for surface wind. ・A surface wind speed increase of more than 4% can be seen up to 500 km from storm center.
Resolution dependency of TC intensity (wind speed) In the simulation mode, TCs in the 20-km model are still weak. Lower resolution models have more difficulty to interpret results.
CMIP3 models ~+10% 0 Extratropical Cyclones Total cyclone number “Strong” cyclone number (<970hPa) Present 21002200 Present 21002200 • When tracking extratropical cyclones.. • Number of cyclones decreases • “Strong” cyclones increase Lambert and Fyfe (2006)
MRI AGCM Same in high-resolution models but with different threshold for + or - Frequency of cyclones as a function of threshold pressure (60km model, 3 ensembles) (20km model) [Future] / [Present] [Future] / [Present] Mizuta et al. (2009)
NH wintertime atmospheric blocking MRI AGCM 20km 60km higher resolution models better represents Atlantic blockings 120km 180km Matsueda et al. (2009) submitted to JGR
Uncertainty in future projections of blocking MRI AGCM long duration blockings decrease 60km ensemble Large warming Medium warming Small warming frequencies of Euro-Atlantic and Pacific blockings are projected to decrease significantly. The larger the warming is, the less blocking frequency Matsueda et al. (2009)
Further regional downscaling is necessary to obtain quantitative assessment of future weather extremes
Dynamical downscaling by RCM 5-km mesh cloud resolving RCM (summer) Boundary condition from 20-km GCM 2-km mesh CRCM (summer) 1-km mesh CRCM (heavy precip events) High resolution climate change information
Three heaviest precipitation total (Ptop3) (OBS) Differences of 1-hour Ptop3 between 20km-AGCM and 5km-NHM are significantly large. Differences become smaller for longer accumulated precipitations. Wakazuki et al. (2008 JMSJ)
Three heaviest precipitation total (Ptop3) Present Future (end of 21c) Change ratio(F-P)/P Present Future/Present Daily maximum precipitation greater than 110 mm/day increases significantly Future (end of 21c)
What is real precipitation? • Uncertainty among observations The areal average precipitation (Asia Land; June-August mean) Rain-gauges + Satellites Rain-gauges Satellites Monthly Daily Error-bar shows amplitude of interannual variability Arakawa et al. (2009)
Can we use satellite-based daily precipitation data to study extreme events? Daily Precipitation for June to August, 2000 at Kagoshima (mm/day) ● Radar-AMeDAS □ GPCP-1DD × TRMM3B42 Satellite-based “observation” underestimates heavy precipitation compared to rain-gauge-based observation (Radar-AMeDAS) Satellite-based rainfall estimation is not sufficient to validate extreme precipitation events simulated by high-resolution models
A QC tool with Google Earth in APHRODITE GHCN (a global dataset) http://www.chikyu.ac.jp/precip Example: Annual precipitation in 1995 at Kathmandu AP. GSOD (GTS base real-time data) Directly obtained from Department of Hydrometorology, Nepal GHCN and GSOD are 1/10 of real data. ⇒Errors in units-of-measurement exist in widely used global datasets!
Summary • Resolution of climate models becomes finer; now we can use 60-km or even 20-km mesh global climate models • Topography is better represented by high resolution model • Large-scale features of model climate improve by increasing horizontal resolution • High resolution model is needed to better represent weather extremes and tropical cyclones • Resolution vs ensemble is an issue • Study to interpret and connect high-resolution and lower-resolution results (e.g. scaling) is needed • Further work for observation data itself • Collaboration with impact assessment group is important (e.g. to avoid misuse of GCM output)