Download

1 / 40
420 likes | 853 Views
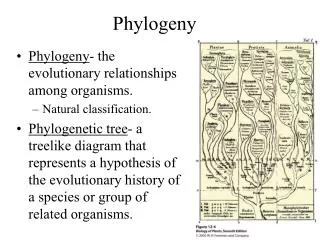
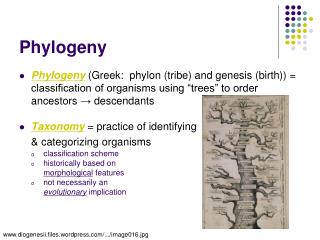
Phylogeny . Reconstructing a phylogeny. The phylogenetic tree (phylogeny) describes the evolutionary relationships between the studied data The data must be comprised of homologous types In molecular evolution, the studied data are homologous DNA/AA sequences

E N D
Reconstructing a phylogeny • The phylogenetic tree (phylogeny) describes the evolutionary relationships between the studied data • The data must be comprised of homologous types • In molecular evolution, the studied data are homologous DNA/AA sequences • Phylogeny reconstruction explicitly assumes that the sequences are aligned INPUT = MSA
Reminder: MSA and phylogeny are dependent MSA Unaligned sequences Sequence alignment Phylogeny reconstruction Inaccurate guide tree
Phylogeny representation Textual representation (Newick format) Visual representation ((A,C),(B,D)); A C B D • Each pair of parenthesis () encloses a clade in the tree • A comma “,” separates the members of the corresponding clade • A semicolon “;” is always the last character
Some terminology monophyletic group (clade) root External branches internal branches (splits) Neighbors Neighbors internal nodes External nodes (leaves)
Swapping neighbors is meaningless Gorilla Human Chimp Human Chimp Gorilla = Gorilla Chimp Human (Gorilla,(Human,Chimp)) = (Gorilla,(Chimp,Human)) = = Chimp Human Gorilla = ((Human,Chimp),Gorilla) = ((Chimp,Human),Gorilla)
Rooted vs. unrooted 3 1 A B C C B A 2 A C B ≠ 3 A 1 ≠ C B 2
In newick format 3 1 A B C C B A ((A,B),C) ((C,B),A) 2 A C B (A,B,C) ((A,C),B) ≠ 3 A 1 ≠ C B 2
Rooting the tree based on a priori knowledge: using an outgroup Human Chimp Gorilla Chicken Human Chicken Gorilla Chimp Chicken Gorilla Human Chimp OUTGROUP INGROUP The outgroup should be close enough for detecting sequence homology, but far enough to be a clear outgroup
The gene tree is not always identical to the species tree Gorilla Chicken Human Chimp Chicken Chicken Human Gorilla Gorilla Human Chimp Chimp Gene tree Species tree ≠
Phylogeny reconstruction approaches C C A A D D A,B E B C B E A D E B Distance based methods: Neighbor Joining The Minimum Evolution (ME) criterion: in each iteration we separate the two sequences which result with the minimal sum of branch lengths
Phylogeny reconstruction approaches 1 4 2 3 1 2 3 4 1 3 2 4 Seq 1: Seq 2: Seq 3: Seq 4: 1 4 2 3 1 2 3 4 1 3 2 4 Topology search methods: MP, ML Maximum Parsimony: finds the most parsimonious topology Maximum Likelihood: finds the most likely topology P(Data|T)
Phylogeny reconstruction approaches: summary • Distance based methods • Neighbor Joining (e.g., using ClustalX) • Fast • Inaccurate • Topology search methods • Maximum parsimony (e.g., using MEGA) • Crude • Questionable statistical basis • Maximum likelihood (e.g., using RAxML, phyML) • Accurate • Slow • Bayesian methods • Monte Carlo Markov Chains (MCMC) (e.g., using MrBayes) • Most accurate • Very slow
Chimp Human Gorilla How robust is our tree?
Bootstrap for estimating robustness • We need some statistical way to estimate the confidence in the tree topology • But we don’t know anything about the distribution of tree topologies • The only data source we have is our data (MSA) • So, we must rely on our own resources: “pull up by your own bootstraps”
Sp1 Sp2 Sp3 Sp4 Bootstrap 1. Create n (100-1000) new MSAs (pseudo-MSAs) by randomly sampling K positions from our original MSA with replacement 12345K 1 : ATCTG…A 2 : ATCTG…C 3 : ACTTA…C 4 : ACCTA…T 11244…3 1 : AATTT…C 2 : AATTT…C 3 : AACTT…T 4 : AACTT…C 97478…10 1 : TTTTA…T 2 : CATAC…A 3 : CATAC…T 4 : AGTGG…A 51578… 12 1 : GAGTA…T 2 : GAGAC…G 3 : AAAAC…A 4 : AAAGG…C
Sp1 Sp2 Sp3 Sp4 Bootstrap 2. Reconstruct a pseudo-tree from each pseudo-MSA with the same method used for reconstructing the original tree 11244…3 1 : AATTT…C 2 : AATTT…C 3 : AACTT…T 4 : AACTT…C 97478…10 1 : TTTTA…T 2 : CATAC…A 3 : CATAC…T 4 : AGTGG…A 51578… 12 1 : GAGTA…T 2 : GAGAC…G 3 : AAAAC…A 4 : AAAGG…C Sp1 Sp1 Sp2 Sp2 Sp3 Sp3 Sp4 Sp4
Sp1 Sp2 Sp3 Sp4 Bootstrap 3. For each split in our original tree, we count the number of times it appeared in the pseudo-trees Sp1 Sp1 Sp2 Sp2 Sp3 Sp3 Sp4 Sp4 67% Sp1 In 67% of the pseudo-trees, the split between SP1+SP2 and the rest of the tree was found 100% Sp2 Sp3 In general bp support < 80% is considered low Sp4
Note: unrooted tree
FigTree: tree visualization and figure creationhttp://tree.bio.ed.ac.uk/software/figtree/
Darwin’s vision of the tree of life from the Origin of Species
Lateral Gene Transfer (LGT) challenges the conceptual basis of phylogenetic classification
Methodology • Started with 36 genes universally present in 191 species (spanning all 3 domains of life), for which orthologs could be unambiguously identified • Eliminated 5 genes that are LGT suspects (mostly tRNA synthetases) • Constructed an MSA for each of the 31 orthogroups • Concatenated all 31 MSAs to a super-MSA of 8090 columns • The phylogeny was reconstructed based on the super-MSA using the maximum likelihood approach
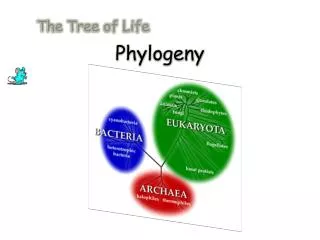
Archaea http://itol.embl.de Eukaryota Bacteria
Tree support • 81.7% of the splits show bootstrap support of over 80% • 65% of the split show bootstrap support of 100% • However, several deep splits show low supports
“Tree of one percent of life” • Ciccarelli et al. on the one hand favor the claim that bacteria adhere to a bifurcating tree of life, given that the small amount of LGT genes are filtered • On the other hand, their filtering process left only 31 proteins, which represent ~1% of an average prokaryotic proteome and ~0.1% of a large eukaryotic proteome • “If throwing out all non-universally distributed genes and all LGT suspects leaves a 1% tree, then we should probably abandon the tree as a working hypothesis”