Download
1 / 30
300 likes | 537 Views
PV Systems (Solar) Hydrogen Fuel Cells Variable Frequency Drives Radiant Heat. Occupancy Sensors Micro Hydro Heat Recovery Units Micro Wind Drip Irrigation. OTHER TECHNOLOGIES. Solar Resources – Total & Diffuse. Semi-Conductor Physics.

E N D
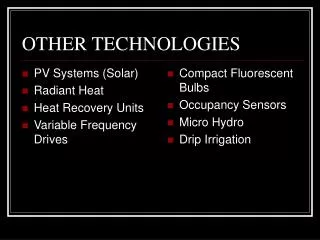
PV Systems (Solar) Hydrogen Fuel Cells Variable Frequency Drives Radiant Heat Occupancy Sensors Micro Hydro Heat Recovery Units Micro Wind Drip Irrigation OTHER TECHNOLOGIES
Semi-Conductor Physics • PV technology uses semi-conductor materials to convert photon energy to electron energy • Many PV devices employ • Silicon (multi-crystalline, amorphous or single) • Other electrically active semiconductor materials • Cadmium telluride, gallium asenide, CIS, etc.
Historic PV modules price/cost decline • 1958: ~$1,000 / Watt • 1970s: ~$100 / Watt • 1980s: ~$10 / Watt • 1990s: ~$3-6 / Watt • 2000-2006: • ~$1.8-2.5/ Watt (cost) • ~$3.50-4.75/ Watt (price)
PV cost projection • $1.50 $1.00 / Watt • 2005 2008 • SOURCE: US DOE / Industry Partners • Today you could have a grid interactive PV System installed by a contractor (Home Depot) for between $6.75 and $8.45 per watt. Equipment Only in range of $4.10-$5.50/watt.
PV system types • Grid Interactive – and BIPV • Stand Alone • Irrigation Pumping / Livestock Watering Troughs • Cathodic Protection • Battery Back-Up Stand Alone • Refrigeration • Communications • Rural Electrification • Lighting
How Large a System do You Need? • Method: • First Determine Electric Use (try to reduce 1st) • Determine Solar Resource (SP, model, calcs) • Select PV Modules or • Select DC-AC Inverter • Assure Module Strings Voc and Isc meet inverter specifications (for max and mins) • Estimate Your Production (1200 kWh/ kW-DC)
NJ Solar (PV) Incentives • NJ Clean Energy Program • $5.10/watt rebate for grid connected systems up to 10kW (Smaller rebates above 10kW) • Net Metering to 2MW • Solar Renewable Energy Certificates • NJ RPS requires 2 MW 2004 90 MW 2008 • < 8 MW currently installed in the state • Currently trading between $80-265/MWh
NJCEP Rebates • Solar Electric Systems 2006 (PV Rebates) * • System Size • 0 to 10,000 watts $5.10/watt • 10,001 to 40,000w $3.90/watt • 40,001 to 100,000w $3.45/watt • 100,001 to 700,000 $3.20/watt * - Reduce by ITC if eligible and to 85% of value for self-install
Economic Value: a NJ Farm • PV Systems would have 25-30 year payback • With NJCEP Rebates reduces to ~ 10 year • With SREC payments it could be less than 7 year • 5 – years of SRECs at 15 ¢/kWh= $3600 for 4kW system • PV Systems can produce between 1100 and 1350 kWh per installed kW annually across New Jersey • Cost After Rebate: ~$9,000 for a 4 kW system • 20year electricity cost: 9.4¢/kWh w/o SREC 5.6¢/kWh w/5yrs of SREC at 15 ¢/kWh
Recent Trades of SRECs ($/MWhr) • Month Max MinCum Av • April 06 $297 $150 $203 • May 06 $260 $100 $204 • June 06 $260 $165 $204
Solar PV - Practical Information • Approx South Facing Roof or field • Roof angles from 20-50 degrees • Less than 200’ from loads • Every 70 square feet of area can yield up to 1000 kWh per year in New Jersey
Radiant Heat • Radiant heat is based on the concept of circulating hot water through the walls or floor of your greenhouse evenly distributing warmth in a clean, quiet and efficient way. • This type of system is a good alternative given a building that has conventional insulating, large open spaces and tall ceilings, when air flushing is common (i.e. garage) and when population allergy sensitivities are high.
Radiant Heat • The system works on the principal of circulating hot water throughout the area to be heated. • The water is pushed through an expansive network of tubing designed to efficiently tunnel the heat to your living areas. • In this system the heat is concentrated at ground level and filtered up to make for a comfortable climate all around.
Radiant Heat Advantages • The heat is evenly distributed throughout the room. • Each room can be specifically set to a certain temperature. • This system is also quieter and more efficient with an average savings of 15-20% than that of forced air. • There is a significant decrease in dry heat which removes the humidity out of the air making radiant heat a more comfortable alternative.
Vapor compression cycle Terribly inefficient (η< 75%) Best known design Energy dissipates as heat Recover Energy Heat water - Therma-stor™ Heat air - Fantech™ Case Studies Dairy farms use hot water to clean equipment HRU preheats water which reduces work done by water heater Economic Summary Heat Recovery Units (HRU) Heating, Venting, and Air Conditioning (HVAC) • Therma-stor™ Fantech™
Hydrogen Fuel Cells • Electrochemical devices that produce electricity using hydrogen and oxygen. • Similar to batteries, but use a hydrogen input fuel. • No need to be recharged. Can be refueled similar to an internal combustion engine (ICE). • Generate energy more cleanly and efficiently (40-60% efficiency) than an ICE. • Can be “stacked” to produce more power. Example: 250kW power plants. • Large scale use is infrequent. • Much research and development is still needed. • Very expensive.
Variable Frequency Drive (VFD) Resolved old problems Heat Generation Harmonics Noise Reliability Common applications Global Electric Market - Pumps (22%), Fans (16%) Other Benefits Increases equipment’s lifespan Reduced wear leads to reduced maintenance
Lighting accounts for approximately 30 – 50% of a building’s power consumption By turning off unnecessary lighting could reduce lighting consumption by 45% Senses movement or lack of movement in a room and consequently turns on or off the lights Rebates Wall mounted ($20 per control) Remote mounted ($35 per control) Daylight dimmers ($25 per fixture controlled) Occupancy controlled hi-low fluorescent controls ($25 per fixture controlled) Occupancy Sensors
Micro-Hydro Power • Hydropower is based on the principal that flowing and falling water have kinetic energy. • A water wheel or a turbine turns this energy into mechanical energy and then into electricity by an electric generator. • Micro-hydro systems generate power on the scale of 5 kW to 100 kW.
Micro-Hydro Power • Best areas for this system: steep rivers flowing all year round and areas with high year round rainfall. • Water flow is greater around winter time and photovoltaic systems are at their lowest point of efficiency. Due to this, many micro hydropower systems are complimented with photovoltaic systems to balance out these deficiencies.
Micro-Hydro Typical Setup • Intake Weir- Located upstream to divert flow of water into the channel. • Channel- transports water from intake weir to forebay tank. • Forebay Tank- filters debris and prevents it from being drawn into turbine and penstock pipe. • Penstock Pipe- carries the water from forebay tank to the powerhouse. • Powerhouse- where turbine and generator convert waterpower into electricity.
Micro-Hydro Power • Theoretical power produced depends on the flow rate of the water, vertical height that the water falls and the acceleration of gravity through the equation: P = Q * H * c • Where P is in units of watts, Q is the flow rate in m3/sec, H is the vertical height in meters and c is the product of the density of water and gravity in kg/m3 and 9.81 m/s2 respectively.
Micro Wind Power Growing at 60% annually Defrays monthly electric bill Requires as little as 5 square ft. of rooftop space Most require 6-12 mph average annual wind speed New Jersey Clean Energy Program offers an incentive of up to 5$ per watt and 60% of eligible system costs for systems up to 10kW. Reduces CO2 emissions Figure 1:MAGWIND 1100 http://www.mag-wind.com/mw1100.php
Drip Irrigation • A replacement for overhead irrigation, which is only 40% to 45% efficient • Has potential to irrigate at 80% to 95% efficiency • May improve upon product quality and crop yield per acre if designed, operated, and maintained properly
Drip Irrigation Benefits • Reduces water use by application directly to areas of a plant where it is needed most • Water will not have the same opportunity to be blown away or evaporated into the atmosphere as with overhead irrigation • Energy usage and losses due to friction are reduced because less pressure and velocity are required while using drip (15 psi to 30 psi as opposed to up to 100 psi for overhead irrigation)
Drip Irrigation Benefits (continued) • Reduces chances for disease since water is applied to the ground and does not lay stagnant on top of crops • Systems are automated and sensor controlled • Reduced watering time • This results in lower carbon emissions (for diesel pumping) and energy demand during peak summer hours
Drip Irrigation Cost and Savings • $700 to $1200 per acre installation cost • Approximately $150 savings per year per acre • This amount is rising due to all of the following: • Decreasing availability of water due to population sprawl • Rising costs of a kilowatt hour and demand charges • Payback period is approximately six years however, increased product quality and yield per acre may decrease the payback period