Download
1 / 49
550 likes | 1.48k Views
. Interspecific Competition. between ? 2 specieswithin same guild/trophic levelsame resources/set of resourcesmutually negative interaction (-/-)decrease in fitness (e.g., fecundity) presumed to cause reduced abundancedoes not involve predation. .

E N D
1. Interspecific Competition
3. Observational
negative correlations between species
attributed to present competition or past (�ghost of competition past�)
can�t determine cause and effect
other factors may be involved
4. Observational + Comparison to null model
compare observed patterns to those generated by chance alone
statistical comparison
challenge is to formulate the appropriate null model
5. Experimental
addition/removal studies
manipulate presence and/or density of would-be competitors
must account for density effects
provides strong inference (strong evidence for or against)
cannot be done with many species
6. 6 Mechanisms of Competition(after Schoener 1983) 1) Consumptive � one species competes with another by consuming a shared resource
7. 6 Mechanisms of Competition 2) Preemptive � occupation of physical habitat by one species, thereby excluding another
9. 6 Mechanisms of Competition 3) Overgrowth � one species grows over another
10. 6 Mechanisms of Competition 4) Chemical � �chemical warfare�
allelopathy in plants; has not been convincingly demonstrated
growth inhibitors in animals
11. 6 Mechanisms of Competition 5) Territorial � aggressive behavioral exclusion
12. 6 Mechanisms of Competition 6) Encounter � nonterritorial encounters between foraging species
wasted time/energy that could�ve been devoted to reproductive output
13. Models of Competition descriptive
mechanistic
14. Exponential Growth J curve
dN/dt = rN
r = intrinsic rate of increase
15. Logistic Growth Model S curve
dN/dt = rN(1-N/K)
dN/dt - population growth rate
r - per capita rate of increase
K - carrying capacity
growth rate decreases as approaches K
max. population size occurs when dN/dt = 0
16. Models of Competition Lotka (1925) & Volterra (1926)
descriptive model
developed with mobile animals in mind
extended logistic model to include two-species competition
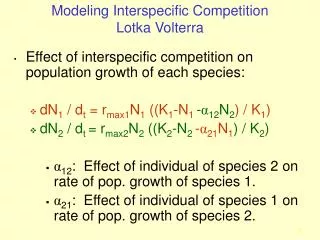
17. Lotka-Volterra Model dN1/dt = r1N1(K1-N1-?12N2)/K1
dN2/dt = r2N2(K2-N2-?21N2)/K2
main difference is a competition coefficient ?ij; effect of species j on species i
How much does species j utilize the carrying capacity of species i?
18. Lotka-Volterra cont� if species I and J are equivalent competitors, ?ij = ?ji = 1; rarely happens
if ?ij < 1 means effect of species j is less than effect of species i on its own members
if ?ji < 1 means effect of species i is less than effect of species j on its own members
19. Zero Isoclines and State-space Graphs dN/dt or growth rate of selected species is set to 0 and you solve for N
give values of N1 and N2 that yield zero population growth for each species
the x axis represents abundance of species 1, and the y axis represents the abundance of species 2
points represent a combination of abundances of species 1 and 2
20. Zero Isoclines population is increasing left of isocline (below K) and decreasing right of isocline (above K)
isocline for species 1 represents a combination of abundances of the two species where species 1 population does not increase or decrease
21. Different Outcomes
22. Arrangements of 2 Isoclines (1) competitive exclusion of species 2 by species 1
population of species 2 goes from 0 to negative under conditions in which species 1 can increase
23. Arrangements of 2 Isoclines (2) competitive exclusion of species 1 by species 2
population of species 1 goes from 0 to negative under conditions in which species 2 can increase
24. Arrangement of 2 Isoclines (3) both species have achieved zero growth (isoclines cross) and stable coexistence (initial abundances do not matter)
25. Arrangement of 2 Isoclines (4) isoclines cross, but whether species coexist depends on initial abundances of the species; unstable equilibrium
26. Lotka-Volterra Summary assumptions
no migration
K and ?ij are constants
stable coexistence is possible only when intraspecific competition is greater than interspecific competition
27. Mechanistic Models of Competition incorporate resources
express competition coefficients & carrying capacities as rates of utilization & resource renewal
Under what conditions do we find coexistence of species?
28. The R* Rule R* - concentration of a resource when a population of a single species grown alone reaches its equilibrium density
winner of competition is determined by which consumer species produces the lower value of R* in the absence of the other
Essentially, who can maintain population at the lowest level of the limiting resource(s)?
29. Tilman�s Models of Competition multi-consumer, multi-resource models
average mortality rate of each species
assumed to be independent of density & resources
supply rates of limiting nutrients
population growth rates as a function of nutrient supply rates
assumed to level off at high rates due to saturation
competition occurs through the effect of each species on the consumed resources (consumptive)
30. Zero-growth IsoclinesCompetitive Exclusion
31. Zero-growth IsoclinesCompetitive Exclusion region 1
below minimum concentration needed to balance growth & mortality
both go extinct
regions 5 & 6
species B wins (lowest R*)
32. Reading Assignment Tilman, D. 1985. The resource ratio hypothesis of plant succession. American Naturalist 125: 827-852.
We�ll discuss this paper next Monday, February 18.
33. Crossing of Zero-growth IsoclinesStable Coexistence region 1 � both go extinct
species A: resource Y limits it most
species B: resource X limits it most
34. Crossing of Zero-growth IsoclinesStable Coexistence CA and CB: consumption vectors or ratio in which the 2 resources consumed by each consumer
species A & B consume resource that limits it the most at a greater rate than it consumes the non-limiting resource
region 4 � stable coexistence
35. Crossing of Zero-growth IsoclinesUnstable Coexistence region 1 � both go extinct
each species consumes resource that limits the other species the most at a greater rate than it consumes the resource most limiting to it
region 4� � unstable coexistence
36. Competition between Algal Species two diatom species
two resources: phosphate and silica
R* is lower for silica than phosphate in Cyclotella
phosphate limits Cyclotella the most
37. Competition between Algal Species two diatom species
two resources: phosphate and silica
R* is lower for phosphate than silica in Asterionella
silica limits Asterionella the most
38. Outcome of Competition 1 - both go extinct
2&3 - Cyclotella wins
4 - stable coexistence
5&6 � Asterionella wins
39. Neighborhood Models of Competition Tilman�s models worked for phytoplankton
resources more homogeneous
don�t work well for terrestrial plant species
spatial relationships are important to competitive outcome in plants
2 main types of models
simulations that keep track spatially of plants
analytical models that capture essence of spatially constrained competition
40. Neighborhood Models of Competition plants compete within neighborhoods
focal plant responds to competitors within a surrounding area
41. Neighborhood Model of Intraspecific Competition within Arabidopsis thaliana Pacala and Silander (1985)
fecundity reduced with number of neighbors
42. Two Species Neighborhood Model of Competition Pacala (1986) - 2 annual plant species without seed dormancy
density of neighbors affects fecundity
main point similar to Lotka- Volterra: coexistence where intraspecific competition > interspecific competition
43. Coexistence of Species some species fail to coexist
those that do coexist, have interspecific differences in resource use
even ecologically similar species differ to some degree
44. Meanings of Niche (1) Grinnell (1914) coined the term
�no two species of birds or mammals will be found to occupy precisely the same niche�
Hardin (1960) � competitive exclusion principle
complete competitors (i.e., those that compete for EXACTLY the same resources in the same way) CANNOT coexist
thus, species that do coexist must differ in resource utilization
niche or resource partitioning, species packing
45. Meanings of Niche (2) Elton (1926)
�what place a species occupies in a community�
functional role of a species
Hutchinson (1957)
range of physical & biological conditions required by a species
n-dimensional hypervolume: each axis corresponds to an individual physical or biological variable
46. Resource Partitioning species that coexist differ in some aspect of their lifestyle (n-dimensional hypervolume)
MacArthur (1958)
foraging differences of 5 warbler species in New Hampshire
partitioning resources by specializing on different structural strata in the forest
47. Fundamental & Realized Niches fundamental
physiological response curve, pre-interactive
range of conditions in which a species can occur in the absence of competitors
absence of other species in general, including facilitators
realized
ecological response curve, post-interactive
range of conditions over which a species occur in the presence of competitors
range will be reduced because competitive exclusion in areas of overlap with competing species
48. after Mueller-Dombois and Ellenberg (1974)
competitors constrain species Z to its ecological response curve (realized niche) Fundamental & Realized Niches
49. Regeneration Niche Grubb (1977)
one more way species can partition up the physical and biological hypervolume
differences in phenology, timing of germination, microsite specialization