Download
1 / 55
580 likes | 693 Views
HRMS Value Measuring Return on Investments in HR Technology Solutions. Presented by . . . . Brendan O’Farrell Chief Executive, HCM International and Chairman, IHRIM Europe. Overview. Organisational Characteristics Management by Fact Measuring/Forecasting Costs

E N D
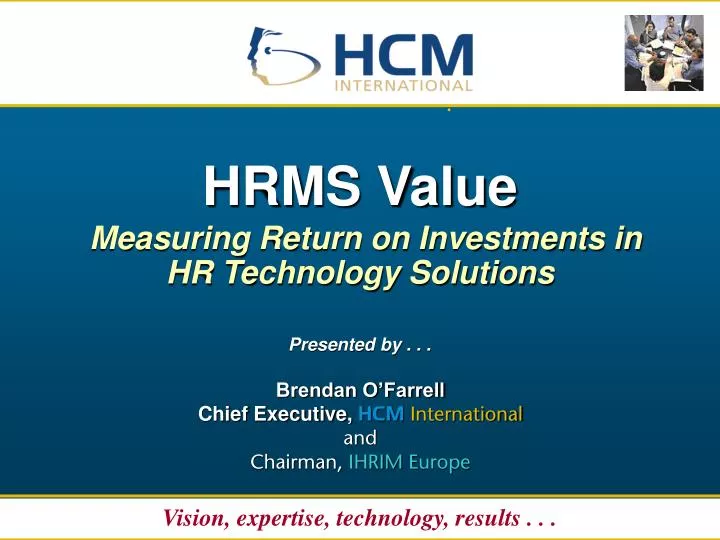
HRMS ValueMeasuring Return on Investments inHR Technology Solutions Presented by . . . Brendan O’FarrellChief Executive, HCMInternational and Chairman, IHRIMEurope
Overview • Organisational Characteristics • Management by Fact • Measuring/Forecasting Costs • Identifying Opportunities • Measuring/Forecasting Costs & Benefits • Required Investments • Determining ROI
Organisational Characteristics Understanding how organisations function and how they approach issues is key to evaluating potential ROI for HR technology investments.
Key Considerations • Complexity • Geographies • Local Legislative • Cultural Considerations (National & Organisational) • Multiple Industry Sector Participation • Distinctly Different Business Lines • Disparate Legacy Systems • Fragmentation • Responsibilities • Accountabilities • Processes
Management Characteristics • Reactive • Focus on issues and problems • Piecemeal • Narrow focus - one issue at a time • Proactive • Focus on objectives & results • Holistic • Top-down emphasis on the whole
Resolving Identified Issues • “Our problem(s) is(are) a, b and c.” • All-too-common approach • Issues with perception vs. reality • Focus is on ‘pain’ - reactive • HR workload • Manager/employee dissatisfaction • Executive pressure • Cost pressure
Objectives & Results • Clearly Defined Objectives • Key business goals • Financial and non-financial • People-driven - clearly identified • Quality Metrics • Analytical rigour • Predictable outcomes • Measured results
Management by Fact “What you don’t measure, you can’t manage.” Peter Drucker
Management by Fact • Current costs • Clearly defined • HR Delivered value • Organisational capability/productivity • Benchmark indices • Ongoing metrics
Current Costs Defined • People Costs • “The sum of all expenditure for the acquisition, development, deployment and rewarding of people, within any organisation.” • HR Costs • “The sum of all expenditure dedicated to managing the acquisition, deployment, development, rewarding and monitoring of human capital, within any organisation.”
Delivered Value - Key Questions • Does the HR Function: • reduce administrative time burdens for managers and employees alike; • assure timely acquisition of required staff resources to pre-defined standards; • provide managers with data and tools to help them manage their people; • provide quality training programmes; • facilitate retention of key people resources?
Delivered Value - Key Metrics • Non-HR manager and employee time devoted to HR administrative processes • Employee satisfaction and commitment • Employee capability • Employee performance • Vacancy duration • Internal rates of promotion • Human Capital ROI
Capability/Productivity • Baseline Capability Metrics • Capability assessment scores • Performance ratings • Retention rates • Baseline Productivity Metrics • Revenue per FTE • Revenue / People Cost • PBT per FTE • PBT / People Cost
Benchmark Indices • HR cost per FTE • Training cost per FTE • Cost per Hire • Annualised rates of employee turnover (attrition) by staff category N. B. - Benchmark indices are only valuable to the extent that they are based on data from sufficient sets of directly comparable organisations.
Benchmarks - Approach with Caution • Benchmark data are often based on averages or medians • Averages include the worst as well as the best organisations • There are far fewer ‘best’ organisations than mediocre or poor ones • Beware of benchmarks that include data from markedly dissimilar organisations
Ongoing Metrics • The most relevant measures are those focusing on internal performance improvement and in relation to targets. • External benchmarks are both less reliable and less indicative of true organisational capability/performance. • Target metrics should be a key component in planning and evaluating all HR technology investments.
Measuring/Forecasting Costs “Time and money are both fungible.” Thomas Watson
HR Function Costs • HR Staff Costs • Total HR staff compensation • Equipment & Systems • Amortised capital cost, plus maintenance and external support • External Services • Consultancy and operational services • Material Resources • Internally retained and/or distributed
20.0 1.5 1.4 1.4 17.5 1.3 1.3 5.5 5.2 15.0 5.0 4.7 4.5 12.5 2.4 2.3 2.2 2.2 2.1 10.0 7.5 10.5 10.0 9.5 5.0 9.0 8.6 2.5 - Year 1 Year 2 Year 3 Year 4 Year 5 HR Staff Equip & Sys Services Materials Cost Forecast Illustration HR Cost - Millions
Other Relevant Costs • Recruitment • Agency fees and advertising • Selection costs (e.g., interview expenses) • Non-HR manager/employee time devoted to: • HR processes (e.g., pay reviews, performance management); • information management; and/or • people data acquisition/manipulation.
Aggregating Staff Cost Data • Ideally, start with complete organisation and population data • Group Categories of Employees into Payroll Cost Bands (e.g., Executive, Managerial, Professional, Administrative) • Compute Average Payroll Costs by Band • Average Base Salaries • Average ‘Burden’ (Social Charges, Benefits, etc.) • Average Total Payroll Costs
Forecasting Assumptions • Salary/wage inflation • For staff costs and external services • Price Inflation • For other costs (equipment, materials, etc.) • Organisational growth • Additional staffing to support growth • Additional equipment, materials, etc. • Timeframes • Suggest five years
Capturing Non-HR Time • Identify Key Process Involvement • Volume, frequency and complexity • Measure or estimate time expenditure • By manager/staff category • Convert to payroll cost • Hourly payroll cost per hours expended • Forecast with salary inflation over appropriate chosen timeframe
Analysis Principles • Analysing Current Processes • Current processes and process components/steps exist for a reason • The reason may no longer be valid • 1st Question: “Does the objective of this process merit its existence”? • 2nd Question: “Does the output of this process deliver value to the business”? • 3rd Question: “How much time/effort on whose part is required to do it well”?
Data Availability • Some data is usually readily available • e.g., HR staff costs • Other data may be more elusive • e.g., manager/employee time devoted to HR processes • Educated estimates may suffice, in the latter case • Analysing processes can confirm estimate validity
Key Points in Assessing Costs • HR costs are HR costs regardless of budget assignment or accounting • Actual HR costs are often ‘hidden’ in other staff function or line budgets and expenses • An accurate assessment of actual total HR costs will yield more precise identification of opportunities
Identifying Opportunities Reducing costs and enhancing delivered value
Opportunities • Identifiable areas of HR management practice that, if changed or modified, could deliver incremental value to the particular business enterprise. • Potential changes in ways of working, processes and/or methods that, if implemented, can be shown to provide measurable improvements in cost, time savings and/or other workplace value.
Benefits • ‘Hard’ benefits • HR workload savings • Other direct • Other indirect • ‘Soft’ benefits • Improvements in manager and/or employee satisfaction/commitment • Greater manager satisfaction with HR • Improved employee understanding of developmental opportunities and resources • Other Benefits
Hard Benefits • HR Workload Savings • Quantifiable reductions in required time and effort on the part of specific HR staff • Other Direct Benefits • Reductions in current HR expenditures for materials, equipment, systems and services • Other Indirect Benefits • Quantifiable savings in time expended by non-HR managers and employees in completing processes required for/by HR
Soft Benefits • There are no direct soft benefits • Returns on investment should not be based on anticipation of soft benefits • Soft benefits are ‘icing’ • Hard benefits are the ‘cake’ • Soft benefits, however, may have value and should not be entirely disregarded • Business investment decisions require predictable and quantifiable returns
Other Benefits • There are other benefits of real value • They result from more effective people management practices • If HR operates more effectively and • If HR practices enhance managers’ ability to manage their people more effectively, • There are measurable bottom line results to be gained • Investment in process improvement and technology can also help deliver these other benefits
Improved People Management • Lower overall employee attrition • Retention of key talent • Greater individual and organisational productivity • Better customer service • Improved customer satisfaction • Greater customer loyalty
SORP • Scepticism • A healthy perspective • Optimism • Beware of undue enthusiasm • Realism • If I can’t count it it doesn’t exist • Pessimism • No more helpful than optimism
Measuring & Forecasting Potential Benefits Hard data, realistic assumptions, sensible timeframes, and appropriate conservatism
HR Payroll Costs • Total FTEs assigned to HR Cost activities, as previously defined • Sum of all: • salaries; • variable cash; • employer’s payroll taxes; and • benefit costs
HR Workload Savings • Analyse HR Staff Time Expenditure • Allocate by HR management functions and processes • Convert to annualised number/type of HR FTEs devoted to each function/process • Assess Current Processes • Determine Expected Time Savings for Redesigned and Automated Processes • Convert to FTE Workload Reductions
Other Direct Benefits • Reduction or Elimination of Current: • HR systems costs (e.g., licensing and support/maintenance) • external HR services costs (e.g., recruiting agency fees and processing services) • materials costs (e.g., printed materials and hard copy reference documents) • equipment costs (e.g., IT hardware, hard copy training documentation, etc.)
Other Indirect Benefits • Value of workload time to be saved by non-HR managers and staff, currently devoted to HR processes (e.g., pay review, performance reviews, etc.) • Assess current time expenditure • Estimate potential time savings for redesigned, automated processes • Convert to payroll cost savings
Ground Rules - Indirect Benefits • If a current process is determined to be unnecessary, it doesn’t count • Eliminate it! (no savings attributable to HR technology investment) • Necessary (valuable) processes • Objective/output has value to business • Time required assumes that process is carried out effectively • Potential time savings based on redesigned, automated processes and new technology implementation
Benefit Realisation #1 • Direct Benefits - Controllable by HR • HR workload savings • Other direct benefits • Indirect Benefits not within HR’s control • Other non-HR managers control indirect benefits realisation • Time savings = headcount reduction or additional revenue generation - a choice • ROI measurement only on payroll cost associated with estimated time savings
Benefit Realisation #2 • A Conservative Approach • Suggested Assumptions • HR workload savings 100% • Other direct benefits 80% • Other Indirect Benefits 50% • No Value Assumed for ‘Soft’ Benefits • Value of other benefits (e.g., improved retention) on a case-by-case basis, only if directly attributable
Required Investments Total costs of acquisition and operation, measured over a 5-year timeframe
Total Cost of Operation (TCO) • Software Licensing Costs • Implementation Costs • Internal project staffing - incremental • External project staffing - consultancy • Training - new technologies • Change management • IT infrastructure - hardware and networks • Ongoing Operational Costs • Software maintenance and support • Staff devoted to support and maintenance
Forecasting Assumptions • Salary/wage inflation - Staff • Price Inflation - Equipment/Infrastructure • Organisational growth • Time Value of Money • Internal rates of return • On invested capital • On capital employed in the business • Cost of capital • Forecast Timeframe - 5 Years
Determining ROI and Other Financial Decision Criteria • Net Present Value of Benefits and Costs • Annualised ROI • Payback Timeframe
Forecasting Benefits and Costs • 5-year Projections • Separate Direct and Indirect Benefits • Assign Benefits and Costs to specific, sequential fiscal periods (e.g., months) • Costs to the time periods in which they are expected to arise • Benefits as well but with appropriate time lags to account for staged roll-out • Based on Relevant Assumptions
Determining Net Present Values • Calculate: • NPV at start for each benefit and cost element from assigned fiscal period • Based on selected financial assumptions (e.g., time value of money) • Sum Results to Determine NPVs for: • Required investments • Direct benefits • Indirect benefits
Determining ROI • Allow for Cost Overrun at 20% • Direct ROI = [(Σ HR Workload Savings + (Other Direct Benefits x .8)) / Σ (Required Investments x 1.2)]1/t - 1 • Total ROI = [Σ HR Workload Savings + (Other Direct Benefits x .8) + (Indirect Benefits x .5)) / Σ (Required Investments x 1.2)1/t - 1 t = Forecast timeframe (e.g., five years)
Payback Timeframes • Calculate Separately for • Direct Benefits • Total Benefits • Number of months until Σ of Benefits to date exceeds Σ of Investments to date Time Series: (Σ Cumulative Benefits - Σ Cumulative Investments) > £1