Download
1 / 21
220 likes | 374 Views
Irrigation energy efficiency evaluations . Energy use - the unknown cost . T he project – pilot study. Funders EECA, Canterbury lines co, meridian , Environment Canterbury 15 on farm evaluations Motor, pump, delivery system Efficiency & Performance

E N D
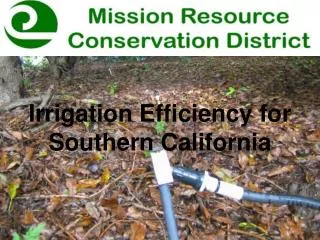
Irrigation energy efficiency evaluations Energy use - the unknown cost
The project – pilot study • Funders EECA, Canterbury lines co, meridian, Environment Canterbury • 15 on farm evaluations • Motor, pump, delivery system Efficiency & Performance • Scheduling/operation efficiency
The outputs • Key Indicators • Energy consumed per volume of water used, kWh/m3 • Power capacity per hectare kW/ha • Cost per m3, $/ m3 • Volume of water used per hectare/ irrigator • System capacity, mm/ha/day
Challenges Awareness of what water costs Data collection - is one flow meter enough? Bench marks Knowledge of what irrigators should be operating at flow and pressure Record keeping – as built plans, commissioning reports, performance testing reports Interpretation of data
What have we found Huge Range Issues Costs Savings Solutions Paybacks
Options for solutions Two pumps feeding two pivots using joined line PRV in network to reduce pressure. The pump curve indicates each putting out around 570kPa of pressure, actual measured pressure is 445kPa, restrictors using 125kPa of pressure.
Issue - system redesign • Acton water charge $38 500 • 25% = $9500 wasted because could not access • Whole system revamp - $182,818.62 • $ 26,396 upgrading mainline • $ 156,422 new pivot. • Access all of Acton water, more water, energy savings from mainline changes, better use of water
What do we need to do Smarter use of water, and electricity, use data Farmers can find it difficult to interpret data - wary of information overload Need to have a starting point – commissioning and understanding very important- baseline to compare from set point within season and between seasons O and M important - be able to ID quantifiable change
Information and tools Tool that combines all of the data streams -Water use, electricity use, climate data. That spits out an automated monthly report with the Key Indicators for them to compare this months data against last month and the month before that …. Regular checks audit? Performance assessment? Asset management