Download
1 / 13
130 likes | 228 Views
DAQ status. Performance of the Mercury part of the DAQ = 234 Hz. Receiving program on vmesparc receives the event from Mercury and immediately acknowledge it. No DMA transfer. No FASTBUS. Internally generated data. Results: Accepted rate = 234 Hz, Rate of errors = 1 Hz Very stable

E N D
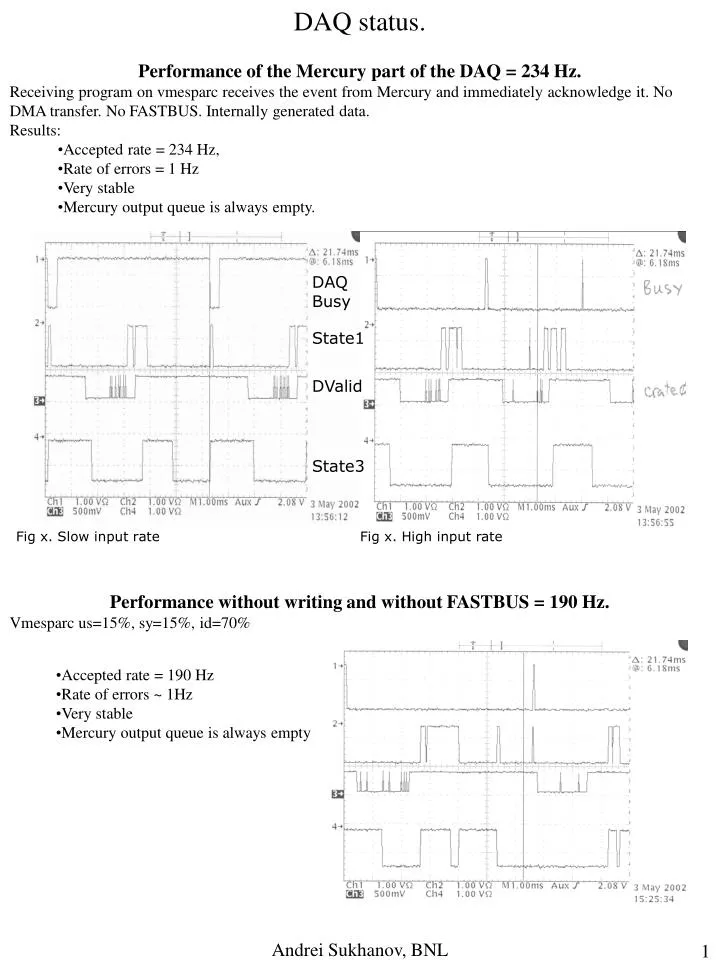
DAQ status. • Performance of the Mercury part of the DAQ = 234 Hz. • Receiving program on vmesparc receives the event from Mercury and immediately acknowledge it. No DMA transfer. No FASTBUS. Internally generated data. • Results: • Accepted rate = 234 Hz, • Rate of errors = 1 Hz • Very stable • Mercury output queue is always empty. DAQ Busy State1 DValid State3 Fig x. Slow input rate Fig x. High input rate Performance without writing and without FASTBUS = 190 Hz. Vmesparc us=15%, sy=15%, id=70% • Accepted rate = 190 Hz • Rate of errors ~ 1Hz • Very stable • Mercury output queue is always empty Andrei Sukhanov, BNL
14 10 15 2 10 8 @ 4.86 ms 11 11 3 14 0 12 7 5,6 1 13 15 DMU transfer 9 4 Fig 205031. Single event. Andrei Sukhanov, BNL
Fig 205032. Two adjacent events. No DMA transfers. Second event applied 400 us after first one. It shows long time between two DMU transfers. 1 2 3 14 15 5,6,7,0 12 ? Expect 100 us 9 10 11 13 14 15 8 DMU transfer DMU transfer Expect it start here 4 Fig 205033. Two adjacent events, same conditions, another example. It shows unusual delay for 700 us in state 2. In previous picture it was same delay but in state 3. 14 ? Expect 100 us ? Expect 10 us Always finishes before the state14 Summary. Delay for 0.7 ms happens at states 2 or 3. Probably, the Mercury is busy with something (finishing the ongoing transfers). Another point: in the case of delay in state2 it finishes the state always slightly before the end of last worker transfer. (I cannot Andrei Sukhanov, BNL
Changed allocation of FECs between workers. Made more uniform. Before that it was longest workers first, shortest at the end. Fig 205061. Single event. No difference with fig. 205031 Fig 205062. Adjacent events. Andrei Sukhanov, BNL
Fig 2050623. Adjacent events. End of the event. Andrei Sukhanov, BNL
Fig 2050624. High rate. Accepted 264 Hz. Fig 2050625. High rate. Accepted 274 Hz. State1 moved after State3. Saved ~ 100 us Andrei Sukhanov, BNL
Fig 2050626. Accepted 274 Hz. All states shown. Prev. event finished First worker active 1 ms 15 8 0 3 5,6 7 2 1 9 11 12 13 14 4 Fig 2050627. Single event. State1 moved after State3. The time 0-3 is smaller (58 us) than in multiple event case (180 us). RACEway more busy? 2 3 0 1 Andrei Sukhanov, BNL
5/6/2002. Results: • No DMA: 274 ev/s • DMA, no FASTBUS, no disk: 203 ev/s, us=13%, sys=15% • Possible improvement: Try to move SMB containing the queue of processed events (EBQueue) from the Master to a Worker. This should make the master less busy due to DMA from the workers. 5/7/2002. DAQ dry run with silicon Working with FECs. External busy 1 ms applied. Fig. 205071. Single event. DMA on. Andrei Sukhanov, BNL
Errors when rate goes above 200 Hz: [0]WorkerMod3(22): Error! Event 327a, FEC2e dmu0=32e0000!=0x80000000. ffaaaa,84000000,b80f007a,0 [0]WorkerMod3(14): Error! Event 34fa, FEC1a dmu0=b01b00fa!=0x80000000. b01b00fa,b01b00fa,b01b00fa,0 [0]WorkerMod3(14): Error! Event 34fa, FEC1a dmu0=b01b00fa!=0x80000000. b01b00fa,b01b00fa,b01b00fa,0 [0]WorkerMod3(14): Error! Event 3515, FEC17 dmu0=3170000!=0x80000000. bbaaaa,820[0]WorkerMod3(19): Error! Event 3515, FEC29 dmu0=3290000!=0x80000000. ffaaaa,84000000,b80a0015,0 00000,b0180015,0 [0]WorkerMod3(14): Error! Event 3515, FEC17 dmu0=3170000!=0x80000000. bbaaaa,82000000,b0180015,0 [0]WorkerMod3(14): Error! Event 3515, FEC17 dmu0=3170000!=0x80000000. bbaaaa,82000000,b0180015,0 What is strange, it shows dmu0=32e0000!=0x80000000 but when it dumps then dmu = 84000000. Oops, it was error in error logging. Fixed error logging problem. Errors in the case of low rate double events: [0]WorkerMod3(14): Error! Event 14b, FEC1a Trail2!=0x80000000. b01b004b,b01b004b,b01b004b,b01b004b • 5/7/2002 12:34 PM Modifications made: • MDC BUSY L2 or’ed with main BUSY. Errors again at 200 Hz: [0]WorkerMod3(14): Error! Event 1028f, FEC17 Trail2!=0x80000000. 3170000,bbaaaa,84000000,b018008f [0]WorkerMod3(14): Error! Event 1028f, FEC17 Trail2!=0x80000000. 3170000,bbaaaa,84000000,b018008f [0]WorkerMod3(14): Error! Event 1028f, FEC17 Trail2!=0x80000000. 3170000,bbaaaa,84000000,b018008f [0]WorkerMod3(14): Error! Event 1028f, FEC17 Trail2!=0x80000000. 3170000,bbaaaa,84000000,b018008f 5/7/2002 1:21 PM Switched off error printout. DMA on, accepted rate = 210 Hz 5/7/2002 1:49 PM Running with DMA off. Accepted rate = 300 Hz, Error rate ~ 1 Hz. 5/7/2002 3:32 PM No DMA mode. Faced a bottleneck at 300 Hz, the EvtAckMCE semaphore sharply drops to 0 from 31. That means the vmesparc is not responding fast enough. 5/7/2002 5:47 PM Took several files with bias off and on. Achieved 184 Hz accepted rate for several sequences. There was no FASTBUS, but this should make any difference. Andrei Sukhanov, BNL
DValid Polling Fig 205151. Polling for the trigger Fig 205152. Polling for the trigger. Double events. Intermittent data transfer. 5/21/2002 Trying to place output queue EBQueue on an inactive worker Andrei Sukhanov, BNL
Fig 205211. EBQueue on empty worker Fig 205212. Example of RINT timeout Fig 205213. EBQueue is on the master. The data transfer is intermittent. RACEway congestions? Fig 205214. EBQueue is on the master. The processing time is longer, 8.4 ms vs. 7.1. 2 2 3 6 7 4 1 4 7 Second event finished @ 8.5 ms Second transfer finished New trigger during transfer Fig 205215. EBQueue is on the master. FECs on. Event size is 108 kB. On previous pictures it was 300 kB. Fig 205216. Same as before but double event. It can run at ~ 400 Hz ! Andrei Sukhanov, BNL
Testing FPDP Transfer I have implemented the data transfer from Mercury to vmesparc using FPDP link (to avoid VME backplane bottleneck at 37 MB/s). The test program on Mercury generates data through the cable at 125 MB/s but vmesparc accepts only 40.00 MB/s sharp. The vmesparc is 50% busy in the system state. I am in contact with hardware vendors to find out what can be done to improve the reading performance. For today this seem to be a current limit of the DAQ bandwidth it will correspond to 400-500 Hz of compressed events. Notice that we can use 2 of our vmesparc's to receive data from Mercury. The FPDP transfer rate does not depend on data size if the size is larger 0.1 MB The FPDP driver support only asynchronous read/write. After starting the operation one must wait until it finished and then get data from a system to the local buffer using GET_DATA ioctl. Without this ioctl the rate is 52 MB/s, but data are not correct of course. Writing speed on usp using “Bonnias -s 1000 -w -d /data/3” is 42 MB/s, sy=67%, id=13%, disk %b=100% If test_fpdp and Bonnias are running simultaneously then Size = 4 MB, FPDP = 38 MB/s, disk = 16 MB/s, sy=80%, id=20%, disk%b=90% Test_fpdp with writing to the disk Size = 0.1 MB, FPDP = 18 MB/s, disk = 17.6 MB/s, sy = 51%, disk%b = 34 After implementing 2-buffer read the FPDP transfer rate become 43 MB/s Size = .1 MB, FPDP = disk = 19.5 MB/s, sy=67%, dsik%b = 37% , w/s = 25 Todo: test at 4MB Note of 9/24/2002 In all FPDP tests reported above there was an unnecessary data move, after removing it, the data transfer rate increased to 64 MB/s. _________________________________________________________________ Andrei Sukhanov, BNL
120 MB/s FFI, balanced crate 0 2 1 Data processing 1.4 ms, finished @ 3.3 ms DValid Busy MDB Fiber transfer 1.28 ms Fig 208051. FECs on, balanced crate. Transfer started @ 490 us, compare with 820 us (Fig. 205071). Transfer time is 1.3 ms, versus 2.1 ms (Fig. 205071). Fig 208052. Busy MDB b 0 b d c 4 2 RINT finished 1 Why it takes > 500 us after the end of Dvalid to detect that RINT finished? DValid Fig 208071. FECs off. (0)-7us->(2)-15us->(3)-31us->(1)-110us->(7) Fig 208072. FECs off. 4 States. Andrei Sukhanov, BNL