Download
1 / 37
370 likes | 375 Views
QuakeSim is a funded project by NASA, AIST, and ACCESS, aimed at building cyber-infrastructure for geophysical research. It involves the development of portlet-based portals, AJAX-enabled geographical information system services, and application services to run codes.

E N D
QuakeSim Work: Web Services, Portlets, Real Time Data Services Marlon Pierce (mpierce@cs.indiana.edu) Contributions: Ahmet Sayar, Galip Aydin, Mehmet Aktas, Harshawardhan Gadgil, Zhigang Qi, Zao Liu Community Grids Lab Indiana University Project Funding: NASA AIST, ACCESS
QuakeSim Project Overview • QuakeSim has been funded by CT, AIST, and ACCESS • Collaboration of geophysicists and computer scientists to build cyber-infrastructure for geophysical research. • CI research and development includes • Portlet-based portals • AJAX enabled • Geographical Information System services • Application services to run codes.
QuakeSim Project Development Overview • Portlet-based portal components allow different portlets to be exchanged between projects. • Form-based portlets --> Interactive Maps • These are clients to Web services • Share with collaborators of REASoN portal. • Sensor Grid: Topic based publish-subscribe systems support operations on streaming data. • Web services allow request/response style access to data and codes. • GIS services (WMS, WFS) • “Execution grid” services for running codes: RDAHMM, ST_Filter • Use application specific WSDL on top of generic code management services. • GPS daily archive Web Services provided by Scripps.
Evolving Project Philosophy • Methodology for interoperability between portal projects exists today. • Portlets, web services • Scripps and IU are proving this. • Must continue to move away from the portal priesthood and towards a “scientific mashup” model. • We still need to develop interesting services and client libraries. • But we should make it easy for the application scientists to • Add their own applications. • Add their own data. • Make their own web applications (ie mashups)
IU Portlet Development We use JSR 168 portlets to build sharable portal plugins.
Portlet Summary * Developed, needs to be converted into a portlet
Sensor Grid Overview Publish/subscribe infrastructure for handling real time data.
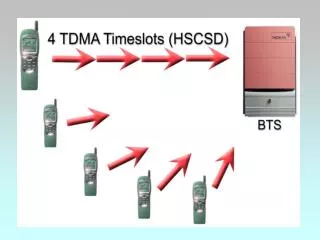
Input Signal Filter Output Signal Real-Time Services for GPS Observations • Real-time data processing is supported by employing filters around publish/subscribe messaging system. • The filters are small applications extended from a generic Filter class to inherit publish and subscribe capabilities.
SensorGrid Tests Galip Aydin – Zhigang Qi 11/16/2006
SensorGrid Tests • Two Major Goals: System Stability and Scalability • Ensuring stability of the Filter Services for continuous operation. • Finding the maximum number of publishers (sensors) and clients that can be supported with a single broker. • Investigate if system scales for large number of sensors and clients.
Test Methodology • The test system consists of a NaradaBrokering server and a three-filter chain for publishing, converting and receiving RYO messages. • We take 4 timings for determining mean end-to-end delivery times of GPS measurements. • The tests were run at least for 24 hours. Ttransfer = (T2 – T1) + (T4 – T3)
1- System Stability Test • The basic system with three filters and one broker. • The average transfer time shows the continuous operation does not degrade the system performance.
We add more GPS networks by running more publishers. The results show that 1000 publishers can be supported with no performance loss. This is an operating system limit. 2 – Multiple Publishers Test
We add more clients by running multiple Simple Filters. The system can support as many as 1000 clients with very low performance decrease. 3 – Multiple Clients Test 1000 Clients Adding clients
Extending Scalability • The limit of the basic system appears to be 1000 clients or publishers. • This is due to an Operating System restriction of open file descriptors. • To overcome this limit we create NaradaBrokering networks with linking multiple brokers. • We run 2 brokers to support 1500 clients. • Number of brokers can be increased indefinitely, so we can potentially support any number of publishers and subscribers. • Still have to test, of course.
Messages published to first broker can be received from the second broker. We take timings on each broker. The results show that the performance is very good and similar to single broker test. 4 – Multiple Brokers Test
4 – Multiple Brokers Test 750 Clients 750 Clients
Test Results • The RYO Publisher filter publishes 24-hour archive of the CRTN_01 GPS network which contains 9 GPS stations. • The single broker configuration can support 1000 clients or networks (9000 stations) • The system can be scaled up by creating NaradaBrokering broker networks. • Message order was preserved in all tests.
Federating Map Servers Zao Liu, Marlon Pierce, Geoffrey Fox Community Grids Laboratory Indiana University
Integrating Map Servers • Geographical Information Systems combine online dynamic maps and databases. • Many GIS software packages exist • GIS servers around state of Indiana • ESRI ArcIMS and ArcMap Server (Marion, Vanderburgh, Hancock, Kosciusco, Huntington, Tippecanoe) • Autodesk MapGuide (Hamilton, Hendricks, Monroe, Wayne) • WTH Mapserver™ Web Mapping Application (Fulton, Cass, Daviess, City of Huntingburg) based on several Open Source projects (Minnesota Map Server) • Challenge: make 17 different county map servers from different companies work together. • 92 counties in Indiana, so potentially 92 different map servers.
Considerations • We assume heterogeneity in GIS map and feature servers. • GIS services are organized bottom-up rather than top-down. • Local city governments, 92 different county governments, multiple Indiana state agencies, inter-state (Ohio, Kentucky) consideration, federal government data providers (Hazus). • Must find a way to federate existing services. • We must reconcile ESRI, Autodesk, OGC, Google Map, and other technical approaches. • Must try to take advantage of Google, ESRI, etc rather than compete. • We must have good performance and interactivity. • Servers must respond quickly--launching queries to 20 different map servers is very inefficient. • Clients should have simplicity and interactivity of Google Maps and similar AJAX style applications.
Caching and Tiling Maps • Federation through caching: • WMS and WFS resources are queried and results are stored on the cache servers. • WMS images are stored as tiles. • These can be assembled into new images on demand (c. f. Google Maps). • Projections and styling can be reconciled. • We can store multiple layers this way. • We build adapters that can work with ESRI and OGC products; tailor to specific counties. • Serving images as tiles • Client programs obtain images directly from our tile server. • That is, don’t go back to the original WMS for every request. • Similar approaches can be used to mediate WFS requests. • This works with Google Map-based clients. • The tile server can re-cache and tile on demand if tile sections are missing.
Map Server Example Marion and Hancock county parcel plots and IDs are overlaid on IU aerial photographic images that are accessed by this mashup using Google Map APIs. We cache and tile all the images from several different map servers. (Marion and Hancock actually use different commercial software.)