Download
1 / 47
480 likes | 559 Views
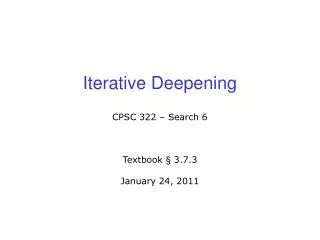
Incorporating (Iterative) Risk Management into the National Climate Assessment. Gary Yohe Vice-Chair of the NCADAC Draft Version presented to the NCADAC August 16 , 2011. A Point of Departure.

E N D
Incorporating (Iterative) Risk Management into the National Climate Assessment Gary Yohe Vice-Chair of the NCADAC Draft Version presented to the NCADAC August 16, 2011
A Point of Departure “Responding to climate change involves an iterative risk management process that includes both adaptation and mitigation and takes into account climate change damages, co-benefits, sustainability, equity and attitudes to risk.” Source: IPCC AR4 Synthesis Report Summary for Policymakers (2007; pg 22)
Widespread Incorporation of this Risk-Management Framing • All four NRC Panel Reports of America’s Climate Choices (ACC) plus the report of the Committee on America’s Climate Choices (CACC) (NRC, 2010a, 2010b, and 2011). • The New York (City) Panel on Climate Change and the associated Adaptation Task Force (NPCC, 2010). • The draft Adaptation Plan for the United States. • The Department of Defense which looks at climate change as a “risk enhancer” (ACC Summit, 2009). • The strategic approach adopted by the National Climate Assessment
Trial Runs – Thanks for Comments • Two versions at the July Executive Secretariat meeting • Phone version to the Forestry sector working team meeting in Atlanta later in July • Presented for discussion at an INCA meeting in July • Draft slides distributed across the RWG in late July • Distributed to the Southwest Region for their initial meeting in early August • Now looking for a nod of approval that the risk-based approach can be operational.
Agenda • Some context for the NCA • Criteria for judging “key vulnerabilities” • Some basics about risk • A practical qualitative risk matrix • Calibration and traceable accounting • Two examples including adaptation and cost • Vulnerability and adaptive capacity • References • Extra slides: iteration and a quantified example
From the NCA Strategic Plan • Vision: • “To advance an inclusive, broad-based and sustained process for assessing and communicating scientific knowledge of the impacts, risks and vulnerabilities associated with a changing climate in support of decision-making across the United States.” • Outcomes (among others…): • “Ongoing analysis of scientific understanding of the climate change impacts, risk, and vulnerability that is relevant to a wide range of decisions and policies” • “Systematic evaluation of progress towards reducing risk, vulnerabilities and impacts”
From the Regional Strategy for the NCA • Minimum Requirements for the 2013 Report: • “To the extent possible, use an integrated, risk-based approach that includes consideration of cross-regional, cross sectoral, and international stressors” • So…. Incorporating risk throughout a technical input and various chapters is aspirational, but inputs will be better received by 2013 report author teams is they speak to risk… at least for key vulnerabilities in a region or sector and cross-cutting themes like the degree to which adaptation and mitigation complement one another
Agenda • Some context for the NCA • Criteria for judging “key vulnerabilities” • Some basics about risk • A practical qualitative risk matrix • Calibration and traceable accounting • Two examples including adaptation and cost • Vulnerability and adaptive capacity • References • Extra slides: iteration and a quantified example
Criteria for Judging Key VulnerabilitiesIPCC (2007) • magnitude, • timing, • persistence/reversibility, • the potential for adaptation, • distributional aspects, • likelihood, and • “importance*” * Based on perceptions of relevant actors, this is not an objective measure
Agenda • Some context for the NCA • Criteria for judging “key vulnerabilities” • Some basics about risk • A practical qualitative risk matrix • Calibration and traceable accounting • Two examples including adaptation and cost • Vulnerability and adaptive capacity • References • Extra slides: iteration and a quantified example
A Convenient Working Definition • Risk is the product of likelihood and consequence. • Consequence (“importance”) can be calibrated in a variety of metrics ranging from physical impacts to vulnerability • Where vulnerability depends on exposure and sensitivity and can be modified by the exercise of adaptive capacity, especially taking account of multiple stressors, and synergies/conflicts with other policy objectives • Likelihood depends on climate sensitivity and associated climate variability
Some Practical Insights • Risk management can be based on • quantitative estimates of likelihood and consequence • OR qualitative but nonetheless rigorous representations of likelihood and consequence; but • either approach should accommodate the full range of possible futures to an extent that depends on the speed of possible iteration • Both can support decision-approaches that vary from site to site and context to context
Illustrative Risk-based Decision Approaches for Identifying and Prioritizing Options: • Straight expected outcome analysis (for quantifiable risk measures) • Precautionary approaches (that set hard limits for acceptable consequences) • Robust decision analysis (that seek responses that best handle extremes at the (small?) expense of efficacy across most possible futures) • Maintaining socially acceptable levels of risk (different from precautionary principle - e.g., NYC) • Constructing risk spreading mechanisms
Agenda • Some context for the NCA • Criteria for judging “key vulnerabilities” • Some basics about risk • A practical qualitative risk matrix • Calibration and traceable accounting • Two examples including adaptation and cost • Vulnerability and adaptive capacity • References • Extra slides: iteration and a quantified example
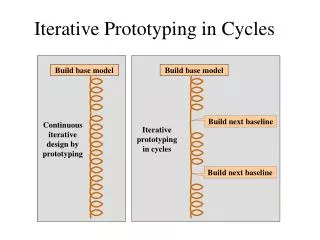
Context: “Iterative” Risk Management ACC Adaptation (NRC, 2010a) and CACC (NRC, 2011)
A “Risk Matrix” Tool for Organizing Thoughts about Risk – Steps 1 & 2 (NRC, 2010a and NPCC, 2010)
For NCA Technical Inputs and Chapters… • No need to report or display the matrices. • They organize thinking and can produce comparable portraits across multiple sources of vulnerabilities. • They are most effective when various stakeholders defend their portraits over time before one another • Portraying likelihoods and consequences for “key vulnerabilities” can increase the likelihood that technical input results find their way into the 2013 chapters and/or support proposals for post-2013 interim NCA products. • They can also portray or illuminate discussions about the value of mitigation and/or adaptation.
Agenda • Some context for the NCA • Criteria for judging “key vulnerabilities” • Some basics about risk • A practical qualitative risk matrix • Calibration and traceable accounting • Two examples including adaptation and cost • Vulnerability and adaptive capacity • References • Extra slides: iteration and a quantified example
Underlying Requirements - Necessities • Calibration of consequences: • Provide a written traceable account to sources used for calibration and the rationale behind the qualitative judgments when applied. • Be careful to • Define the metric of consequence (eg: economic consequences, human health consequences, etc…) and describe the rationale for approach selected • Address the sensitivity of consequences to the influence of multiple stresses if possible • Perhaps move beyond physical impacts to consider vulnerability as a function of exposure, sensitivity and adaptive capacity
Underlying Requirements - Necessities • Calibration of likelihood: • Provide a written traceable account to sources used for the calibration and the rationale behind the qualitative judgments when applied. • That is, derive likelihood judgments from documented sources in a transparent manner and describe the process from which the judgment emerged. • Use “uncertainty guidance” language.
An Important Caveat Calibrations of either likelihood or consequence that are derived from sources that cannot meet IQA standards cannot and will not be included in NCA products.
Nonetheless - A Critical Implication of the Risk-Based Approach to the NCA • The Assessment will focus attention not only on central tendency highly likely impacts and vulnerabilities, but also on lower likelihood impacts and vulnerabilities that carry high consequences. • This is NOT fear-mongering; it is responding to our clients’ recognition that it is risk that matters and that high risk can be the result of large consequences across key vulnerabilities along even low-likelihood futures. • Extreme events driven by climate variability around climate trends may be the most frequent and most visible source of high consequence futures.
Agenda • Some context for the NCA • Criteria for judging “key vulnerabilities” • Some basics about risk • A practical qualitative risk matrix • Calibration and traceable accounting • Two examples including adaptation and cost • Vulnerability and adaptive capacity • References • Extra slides: iteration and a quantified example
Example 1: Relevant Current and Future Climate Changes (from NPCC, 2010) Depending on sea level rise futures that in turn depend on emissions trajectories that in turn depend on decisions taken in the near-term and beyond…. Flooding event 2020’s 2050’s 2080’s 1/10 years 8-10 yrs 3-6 yrs 1-3 yrs 1/100 years 65-85 yrs 35-55 yrs 15-35 yrs
Traceable Account to NPCC (2010) • Consequence: • Economic damage and some potential loss of life from published insured loss data; grows over time • The 100 year storm is a source of a “key vulnerability” because it meets magnitude and timing criteria; not reversible; expensive adaptation possible; important to economic sectors) • Likelihood: • Judgments derived from published climate model predictions of SLR and associated effect on return times of storms • Note: Upper lines indicate higher emissions (little mitigation) and/or high climate sensitivity; lower lines indicate lower emissions (greater mitigation) and/or low climate sensitivity.
Example 2: Relevant Current and Future Climate Changes (Also from NPCC, 2010) Depending on temperature futures that in turn depend on emissions trajectories that in turn depend on decisions taken in the near-term and beyond…. Days > 90o 2020’s 2050’s 2080’s 14/yr 23-29/yr 29-45/yr 37-64/yr
Traceable Account to NPCC (2010) • Consequence: • Potential significant loss of life and other health impacts from published hospital records used in a peer reviewed document • Meets “key vulnerability” criteria of magnitude, timing, and distributional criteria; significant social importance; adaptation not expensive (cooling stations, e.g.) • Likelihood: • Judgments derived from published climate model predictions of correlations between extreme heat event and changes in global mean temperature found in peer reviewed sources.
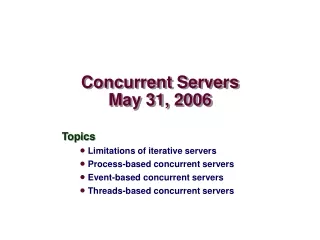
New Examples from ForestryContributed by Louis Iverson • Louis Iverson took the initiative to try the risk-matrix framing for various species of the forestry sector • His work was discussed at length on a phone conversation with many forestry sector participants • Care was taken to define consequence and likelihood carefully • Care was also taken to extend past biophysical impacts through ecosystem services a la the Millennium Ecosystem Assessment • His example shows that consequences can be positive as well as negative – opportunities included!
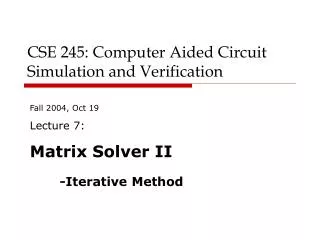
Risk of Habitat Change in 3 Species Northern Wisconsin Gainers Losers Low 2100 2040 2070 2100 2100 Black Ash 2070 Magnitude of Adaptability to CC Medium 2040 2070 2040 Yellow Poplar White Oak High NewMigrant Very High Medium Low Medium High Very High High Low Relative Expected Change in Suitable Habitat Iverson et al., unpublished Develop Strategies Evaluate Further/ Develop Strategies PCMlo (mild) Hadhi (harsh) Watch
Comparisons Across these Risks • Likelihood scales can be comparable if they are derived from consistent outputs from the same climate models with the same variability in drivers and the same storylines. • Consequence scales are expressed in different metrics, so stakeholder discussions and public defense generated comparability in judgments about the magnitude of the consequences.
Agenda • Some context for the NCA • Criteria for judging “key vulnerabilities” • Some basics about risk • A practical qualitative risk matrix • Calibration and traceable accounting • Two examples including adaptation and cost • Vulnerability and adaptive capacity • References • Extra slides: iteration and a quantified example
Synergies and Mainstreaming • Vulnerability can depend on: • Exposure – adaptation can reduce the likelihood range for a given vulnerability along a particular climate change trajectory. • Sensitivity – adaptation can reduce the consequence range for a given vulnerability along a particular climate change trajectory. • Multiple stressors including international connections, integrated responses (mainstreaming), and barriers to adaptation can enlarge or move ovals along a particular climate change trajectory.
Determinants of Adaptive Capacity[from Yohe and Tol (2002)] • Availability of adaptation options • Access to resources • Strength of governance infrastructure (including social and human capital as well as a responsible decision-maker or decision-making institution within government) • Ability to distinguish between signal and noise • Access to risk-spreading mechanisms • Strong public perception of a causal link to climate change A working Hypothesis: the fundamental determinant of adaptive capacity is the weakest of these.
Agenda • Some context for the NCA • Criteria for judging “key vulnerabilities” • Some basics about risk • A practical qualitative risk matrix • Calibration and traceable accounting • Two examples including adaptation and cost • Vulnerability and adaptive capacity • References • Extra slides: iteration and a quantified example
References • Intergovernmental Panel on Climate Change (IPCC), Climate Change 2007: Synthesis Report, Cambridge University Press, Cambridge, 2007. • National Research Council (NRC), Adapting to the Impacts of Climate Change, Report of the Panel on Adapting to the Impacts of Climate Change, America’s Climate Choices, 2010a, http://www.nas.edu. • National Research Council (NRC), Informing Decisions on Climate Change, Report of the Panel on Informing Decisions on Climate Change, America’s Climate Choices, 2010b, http://www.nas.edu. • National Research Council (NRC), Report of the Committee on Americas Climate Choices, 2011, http://www.nas.edu. • New York City Panel on Climate Change, 2010, Climate Change Adaptation in New York City: Building a Risk Management Response. C. Rosenzweig & W. Solecki,Eds, prepared for use by the New York City Climate Change Adaptation Task Force, Annals of the New York Academy of Sciences, New York, NY. 349 pp, http://www.nyas.org. • Yohe, G. and Tol, R., “Indicators for Social and Economic Coping Capacity – Moving Toward a Working Definition of Adaptive Capacity”, Global Environmental Change 12: 25-40, 2002. • Yohe, G., “Risk Assessment and Risk Management for Infrastructure Planning and Investment”, The Bridge 40(3): 14-21, National Academy of Engineering, 2010.
Agenda • Some context for the NCA • Criteria for judging “key vulnerabilities” • Some basics about risk • A practical qualitative risk matrix • Calibration and traceable accounting • Two examples including adaptation and cost • Vulnerability and adaptive capacity • References • Extra slides: iteration and a quantified example
This Leads to a Final Question: What to Monitor? • Define decision-specific indicators – work with stakeholders and decision-makers. • Understand sensitivity to emissions trajectories, mitigation decisions, and climate sensitivity – communicate with stakeholders and decision-makers. • Monitor and evaluate adaptation performance and the roles of synergies and confounding factors – keep track of moving toward looming “dark tails”. • Understand the economics of iteration cycles – promote transparency and predictability.
A Quantified Example: Coastal Adaptation Driven by Climate Variability • Two SLR scenarios (0.6m and 1.0m through 2100) – so abstracting from uncertainty about SLR for the moment • The value of adaptation will depend on coping with stochastically distributed coastal storms: • Inundation from secular trend • Flooding and other damage from coastal storms
Two Adaptations in two Boston Locations: Zone 2 (Urban) and Zone 3 (Suburban)
Adaptation Alternatives {Kirshen, et al. (2008)}: • Zone 2 (Urban): • A major investment in a protective structure (BYWO) costing $390 million at some time to be determined; persistent annual maintenance expense will be incurred after the investment is completed. • Zone 3: (Suburban): • GREEN adaptation programs involving flood-proofing residential & commercial property; expenses begin immediately and persist over time to reduce property damage, accommodate wetland migration and preserve protective wetland services.
The Economic Value of GREEN Adaptationover the Time in Zone 3 Higher aversion to risk increases the value of GREEN adaptation; so insurance could free resources for other uses
The Economic Value of BYWO Adaptationin Zone 2 {Internal Rates of Return over Time} IRR increases with time and with aversion to risk and so does the likelihood of investing