Download
1 / 43
440 likes | 586 Views
Determining the dynamics of the ultracompact HII region (UCHII) Monoceros R2. A. Fuente Observatorio Astronómico Nacional (OAN). Why to study Monoceros R2?. Dynamically:

E N D
Determining the dynamics of the ultracompact HII region (UCHII) Monoceros R2 A. Fuente Observatorio Astronómico Nacional (OAN)
Why to study Monoceros R2? Dynamically: It is the closest UC HII region (d=830pc) and the best target to investigate this evolutionary stage in the formation of massive stars From the chemical point of view: Excellent target to investigate the chemistry of dense (n>105 cm-3) photon-dissociation regions with high UV fluxes (G0=5 105 Habing field). Pattern for Xgal and protostellar disks Very simple geometry which allows detailed modeling
The latest stage in the formation of a massive star Massive pre-stellar core → High mass protostellar object (HMPO) → Hot core → UC HII region * Figure adapted from van Dishoeck et al. (2011, PASP 123, 138)
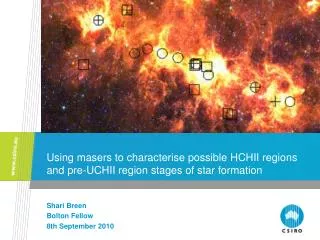
Lifetime Paradox Ultracompact HII regions are characterized for very small spatial scales (< 0.1 pc) and being embedded in the molecular cloud. With densities of a few 105 cm-3, typical of giant molecular clouds the UCHII is expected to expand and its lifetime as UCHII is of around one thousand of years. However the number of UCHII detected proves that the lifetime should be larger (“lifetime paradox”). Lifetime of UCHII should be around 105 yr.
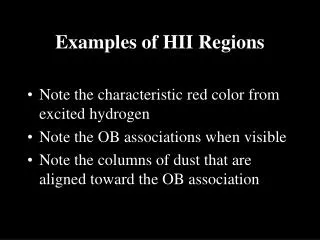
Photodissociation Regions (PDRs) Orion Bar 104 Draine Field cluster O stars 450pc edge-on
Mon R2: a prototypical UC HII region 13CO 2-1 C18O 2-1 FIRS 1 FIRS 1 Mol. bar Mol. bar A small cluster of young stars (FIRS 1, 2, 3, 4, 5) is in the center of the HII region. The UC HII region is ionized by the more massive young B star FIRS 1 Observational study using the IRAM 30m telescope and Herschel (Mon R2 is one of the sources of the HSO Guarantee Time Key Project WADI (PI: Volker Ossenkopf)
CO+ and HOC+ in MonR2(Rizzo et al. 2003, ApJ 577, L153) Detection of CO+ and HOC+ in the ionization front (IF) Abundance gradient between the IF and the Molecular Bar
C2H, c-C3H2, some dynamicsRizzo et al. (2005, ApJ 634, 1133)
c-C3H2 C1 C2 5 105 cm-3 >5 106 cm-3
Probing the dense expanding layer around the UCHII region Different excitation properties: C1 n(H2) about 5 105 cm-3 C2 n(H2) always > 5 106 cm -3 Different chemical properties C2 only detected in PDR tracers C2 C1
Spitzer data (PAHs and H2)Berné et al. (2009), ApJ 706, L160 Bright, extended emission of the PAHs bands and H2 rotational lines Layered structure expected in a PDR Different PDRs around UCHII region (different physical and chemical conditions)
G0 and nH estimates from PAHs and H2 H2 rotational lines are thermalized for n>104 cm-3 The I6.2/I11.3 ratio is tracing the UV field allow to determine the [PAH+]/[PAH0] ratio and the UV field (Galliano et al. 2008).
Mon R2: a prototypical UC HII region 13CO 2-1 C18O 2-1 FIRS 1 FIRS 1 Mol. bar Mol. bar Cuts in CH (536 GHz, includes HCO+ 6-5), H2O (556GHz and 1113 GHz), CO 9-8, 13CO 10-9, CII, CH+ Pointed observations of OH+, H3O+, H2O+, NH, 13CII, H218O
Massive star forming region 12CO 9-8 13CO 10-9 CII o-NH3 10-00 o-H2O 110-001 p-H2O 111-00o
Modeling water in Mon 2Pilleri et al. 2011 (in preparation) D=830 pc Compact NeII emission= 24" (diameter) Hole of molecular emission= 40" (diameter) N(H2)= 2-- 6 1022 cm-2 Size of the core= 2' (diameter) Our model: 1st thin layer= 1mag with n=4 105 cm-3 2nd dense layer= 14 mag with n=6 106 cm-3 3rd low density layer= 50 mag with n= 5 104 cm-3 Vexpansion=0.5 (R/Rout)-1 (from Fuente et al. 2010)
Non-local ALI model(Pilleri et al. 2011, in preparation) Spherical model Non local radiative transfer ( Cernicharo et al. 2006, ApJ 642, 940)
Modeling water in Mon 2Pilleri et al. 2011 (in preparation) Meudon PDR code v1.4.1 (Bourlot et al. 2006) High velocity expanding layer Tk >100 K X(o-H2O) ≈10-7 Low velocity molecular cloud Tk<100 K X(o-H2O)≈ 10-8
Absorption lines (OH+,H2O+) OH+ absorption at redshifted and blueshifted velocities The only way to explain the redshifted absorption is to assume the existence of a collapsing outer low density envelope. Expansion Collapse
Absorption lines (OH+,H2O+) [OH+]/[H2O+]=0.8 f(H2)=0.07 Similar to diffuse clouds (see Gerin et al. 2010)
Conclusions Thin (1 mag) and dense (5 105 cm-3) expanding layer Traced by high-J CO rotational lines and water (Herschel data). Reasonably well explained by gas phase PDR chemical models Thin (10mag) and dense (< 106 cm-3) molecular layer Traced by IRAM and Herschel data. Partially explained by gas phase PDR chemical models. Thick (50mag) and low density collapsing layer (104 cm-3) OH+ absorption lines
3mm IRAM spectral surveyGinard et al. 2011 (in preparation) Three targetted positions: (i) IF (ii) Molecular Bar (iii) PAH peak 2 MHz -> 6 km/s
IF IF
List of detected species First detection of SO+ and C4H in Mon R2 IF: 23 species (+ CO+ andHOC+) Mol Bar: about 30 species Well known PDR tracers but also complex species common in warm star forming regions Chemical differences among the 3 positions.
The fragmented ISM in the nucleus of M 82 A. Fuente Observatorio Astronómico Nacional (OAN)
M 82 M82 is one of the nearest and brightest starburst galaxies. Located at a distance of 3.9 Mpc, and with a luminosity of 3.7x 10¹⁰ Lsun , it has been extensively studied at all wavelengths.
M 82 1.- Compared to other prototypical nearby starburst galaxies like NGC 253 and IC 342, M82 presents systematically low abundances of the molecules NH3 , CH3 OH, CH3 CN, HNCO, and SiO (Mauesberger & Henkel 1989, A&A 223, 79; Weiss et al. 2001, ApJ 554, L143). 2.- Wolfire et al. (1990, ApJ 358, 116) modeled the C II , Si II , and O I emission and estimateda UV field of G0 =104 in units of the Habing field and a density of n >104 cm-3 for the atomic component. 3.- Suchkov et al. (1993, ApJ 413, 542) estimates a cosmic ray flux of 4 10-15 s-1, 100 times higher than the Galactic value.
M 82 (García-Burillo et al. 2002, ApJ 575, L55) Izqda: Emisión de SiO (García-Burillo et al. 2001, ApJ 563, L27) superpuesta a la imagen de continuo a 4.8 GHz (Wills et al. 1999, MNRAS 309, 395). Dcha: Emisión de HCO superpuesta a la emisión de H13CO+ (A) y CO (García-Burillo et al., 2002, ApJ 575, L55; Mao et al. 2000, A&A 358,433)
M 82 (García-Burillo et al. 2002, ApJ 575, L55) A high N(HCO)/N(H13CO+) ratio is an evidence for PDR. N (HCO)/N (H13CO+) abundance ratios range from ∼ 50 (Horesehead), ∼ 30 (in the Orion bar) to ∼ 3 (in NGC 7023). N (HCO)/N (H13CO+)∼ 3.6 in M82, the nuclear disk of M82 can be viewed as a giant PDR of 650 pc.
CN/HCN ratio in M 82 (Fuente et al. 2005, ApJ 619, L155) The [CN]/[HCN] and [HCO+]/[HOC+] ratios in all the disk of M82 (650pc) similar to the Orion Bar. This comfirms that the nucleus of M82 is a giant PDR.
CO+ and HOC+ in M82 (Fuente et al. 2006, ApJ 641, L105) [CO+]/[HCO+] >0.04 are measured across the inner 650 pc of the nuclear disk of M82. [HCO+]/[HOC+] ∼40
Preliminary model (Fuente et al. 2005, ApJ 619, L155) The low [HCO+]/[HOC+] ratio can only be explained if the nucleus of M82 is formed by small (r ~0.02–0.2 pc) and dense (n ∼ a few times 104 –105 cm-3 ) clouds immersed in an intense UV field of 104 ( in units of the Habing field) and with an enhanced cosmic ray flux.
Detection of H3O+ (van der Tak et al. 2008, ApJ 492, L675) Van der Tak et al. (2008) detected H3O+ using the JCMT. They concluded in agreement with our results, that the H3O+ abundance is consistent with that expected in a PDR with enhanced cosmic ray flux.
M 82: XDR or PDR? (Spaans & Meijerink 2007, ApJ 664, L23)
Interferometric observations of M 82 (Fuente et al. 2008, ApJ 492, L675) The HOC+ emission comex from the galaxy disk like most molecular species. There is no spatial correlation between the HOC+ abundance and the [HOC+]/[HCO+] ratio with the X ray flux.
Interferometric observations of M 82 (Fuente et al. 2008, ApJ 492, L675) We model our clouds using the updated Meudon code and plane clouds illuminated from the both sides.
Interferometric observations of M 82 (Fuente et al. 2008, ApJ 492, L675) We cannot fit the [CO+]/[HCO+] and [CN]/[HCN] ratios with a single cloud type. We can better fit the observations if we consider two types of clouds: (i) most of the mass(87%) is in small clouds of Av=5mag; (ii) a small percentage of the mass (13%) is in very large molecular clouds (50 mag) .
Starburst evolution The differences between the chemistry of NGC 253, IC 342 and M82 can be understood as an indicator of different phases of starburst evolution, being NGC 253 in an earlier phase and M82, the more evolved one (García-Burillo et al., 2002, ApJ 575, L55, Aladro et al. 2011, A&A 525, 89). Aladro et al. 2011, A&A 525, 89
Other Xgal PDRs (M51 and M83) M 51 M 83 Tony & Daphne Hallas Stephane Guisard & Robert Gendler
Other Xgal PDRs (Kramer et al., 2005, A&A 441, 961) They compare the emission of the CI and CO rotational lines with the FIR lines of CII (157 µm), OI(63 μm) and NII (122μm) (ISO data) in terms of PDRs.
Other Xgal PDRs (Kramer et al., 2005, A&A 441, 961) The best fits to the latter ratios yield densities of 104 cm−3 and FUV fields of ∼G0 = 20–30 times the average interstellar field. At the outer positions, the observed total infrared intensities are in agreement with the derived best fitting FUV intensities. The ratio of the two intensities lies at 4–5 at the nuclei, indicating the presence of other mechanisms heating the dust
Conclusion The study of the physics and chemistry of PDRs is useful, even necessary, for the comprehension of the evolution of the ISM in our Galaxy and external galaxies.