Download
1 / 28
280 likes | 379 Views
Econ 201 Spring 09 Lecture 4.2. Microeconomics - A Firm’s Perspective: Costs of Production & Supply. Firm’s Objectives. Maximize Profits Total Revenues – Total Costs of Production Assume (for the time being) Firm is a price-taker (no market power)

E N D
Econ 201Spring 09Lecture 4.2 Microeconomics - A Firm’s Perspective: Costs of Production & Supply
Firm’s Objectives • Maximize Profits • Total Revenues – Total Costs of Production • Assume (for the time being) • Firm is a price-taker (no market power) • Price is constant and independent of the level of the firm’s output • TR = P x Qs • Firm can choose (variable): • Types and quantities of inputs • Level of output
Long-run vs. Short-run • In the long-run all inputs and costs are variable • Before entering the market, no costs are incurred • Decisions are: (1) to enter the market; (2) and how much to produce • In the short-run at least one input is fixed (Sunk costs) • Typically capital • Decision is how much to produce • Zero is an option
Types of Costs • In the short-run • Fixed (sunk) costs • Costs that are incurred, regardless of the level of output • E.g., Capital equipment – machinery, computers, buildings • Variable costs • Costs that vary with the level of output • E.g., labor, fuel and materials • Total Costs(Q) = Fixed Costs + Variable Costs(Q) • In the long-run • All costs are variable (dependent on entry decision)
How Do These Costs Vary with Output? • Fixed Costs • Independent of level of output (Q) • AFC = FC/Q • Variable Costs • Vary with level of output • AVC = VC(Q)/Q
Putting It All Together • Short-run Cost Curve • ATC = AFC + AVC
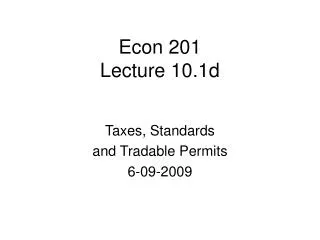
Why Is the ATC U-shaped? • Economies of Scale and Scope • Increase in output from Q to Q2 causes a decrease in the average cost of each unit from C to C1. • Indivisibility of resources, specialization, bargaining power (CostCo)
Why is the ATC U-shaped? • Beyond Q (ideal firm size), additional production will increase per-unit costs • Exceed max efficient scale, communications issues, duplication of effort, entrepreneurial ability
Why is the ATC U-Shaped? • Economies and diseconomies of scale
Long-run vs. Short-run Decisions • Firm’s decision to enter the market: • Are Total Revenues > Total Costs? • At point of entry -> all costs are variable • Costs also include opportunity costs • Opp. Costs for resources are signaled by market prices for inputs • Opp. Costs of money invested -> “normal rate of return” • Opp. Costs for your (owner’s) labor -> what you could have earned elsewhere • In the short-run decision on how much to produce: • Are Revenues > Variable Costs? • Fixed Costs are “sunk” and irrelevant to production decision
Will the Firm Enter the Market? • Assume • Firm is a price-taker/has no market power • So no matter how much the firm is willing to supply, its decision has no impact on the market demand price • Firm’s revenues then are: • TR = P x Qs • Assume market price is $4 per zuke
What is this Firm’s Supply Curve? • Will the firm to enter the market at p = $4?
What is this Firm’s Supply Curve? • What are the firm’s fixed costs? • What is the minimum Qs at $4 per zuke? • What is the maximum Qs at $4 per zuke?
A Graphical Version • Firm’s entry decision is based on: TR > TC? • Between Qs = 4->9: TR > TC • How much to produce?
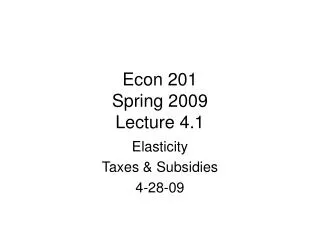
What is the Profit Maximizing Output for the Firm? • http://www.amosweb.com/cgi-bin/awb_nav.pl?s=wpd&c=dsp&k=perfect%20competition,%20short-run%20production%20analysis • When the firm is a price-taker: profits are max’ed when TR-TC are greatest • Largest vertical difference between the TR and TC curve
Firm Chooses How Much to Supply By Maximizing Its Profits • When the firm is a price-taker: profits are max’ed when TR-TC are greatest • Largest vertical difference between the TR and TC curve • http://www.amosweb.com/cgibin/awb_nav.pl?s=wpd&c=dsp&k=perfect%20competition,%20short-run%20production%20analysis
What is this Firm’s Supply Curve? • Firm’s profit maximizing output is at Q =7 • Rule is profit maximizing output is MR = MC • Since firm is a price-taker: MR = P => P = MC
Firm’s Supply Curve • Firm’s supply curve • Marginal Cost curve • In the long-run: • P >= MC • TR >= TC (=TFC + TVC) • In the short-run • P >= MC • TR >= Total Variable Costs (TVC) • There is a price below which a firm can not afford to supply any of the good
Short-run Supply Curve Firm will supply if P > AVC
Factors that Shift Supply Curves • Individual Firms and Market Supply • Prices of Inputs • Qs goes down if price of inputs goes up • Supply curve shifts to the left • SC shifts right if price of inputs goes down • Technology • Technological improvement -> inputs are more productive • Same as input prices going down -> shift to the right of SC • Market Supply Only • Number of firms
Firm and Market Supply Curves • Similar to Individual and Market Demand Curves • Market supply curve = sum of all of the individual firm supply curves • Graphically • Horizontal sum of the quantities supplied by each firm at a given price
Useful Websites • Understanding differences between factors that cause shifts in demand or supply • http://hspm.sph.sc.edu/COURSES/ECON/SD/SD.html • http://www.investopedia.com/university/economics/economics3.asp
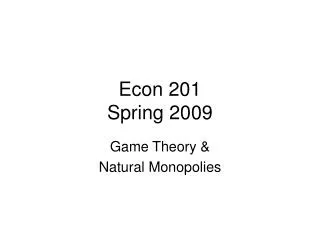
Supply Curves • First law of supply • Like the law of demand, the law of supply demonstrates the quantities that will be sold at a certain price. But unlike the law of demand, the supply relationship shows an upward slope. This means that the higher the price, the higher the quantity supplied. Producers supply more at a higher price because selling a higher quantity at a higher price increases revenue. A, B and C are points on the supply curve. Each point on the curve reflects a direct correlation between quantity supplied (Q) and price (P). At point B, the quantity supplied will be Q2 and the price will be P2, and so on.
Firm’s Objective • Once the firm has decided to enter the market • Objective will to be minimize the costs of producing a given level of output • That is, minimize
The Production Function • the production function, summarizes the process of conversion of factors into a particular commodity. • first proposed by Philip Wicksteed (1894): • Q = F(K,L,E,M;T) • relates a output y to a series of factors of production K, L, E, M – given current technology T. • http://cepa.newschool.edu/het/essays/product/prodfunc.htm