Download
1 / 2
30 likes | 62 Views
Semicon soft,Inc is the premier source of thin-film thickness measurement instrument . We are located in Southborough, MA USA. We offer various measurement instruments like thin film measurement system, optical spectroscopy , data analysis software etc. Our solution are available for a variety of applications, from desktop and to in-situ to in-line measurement.

E N D
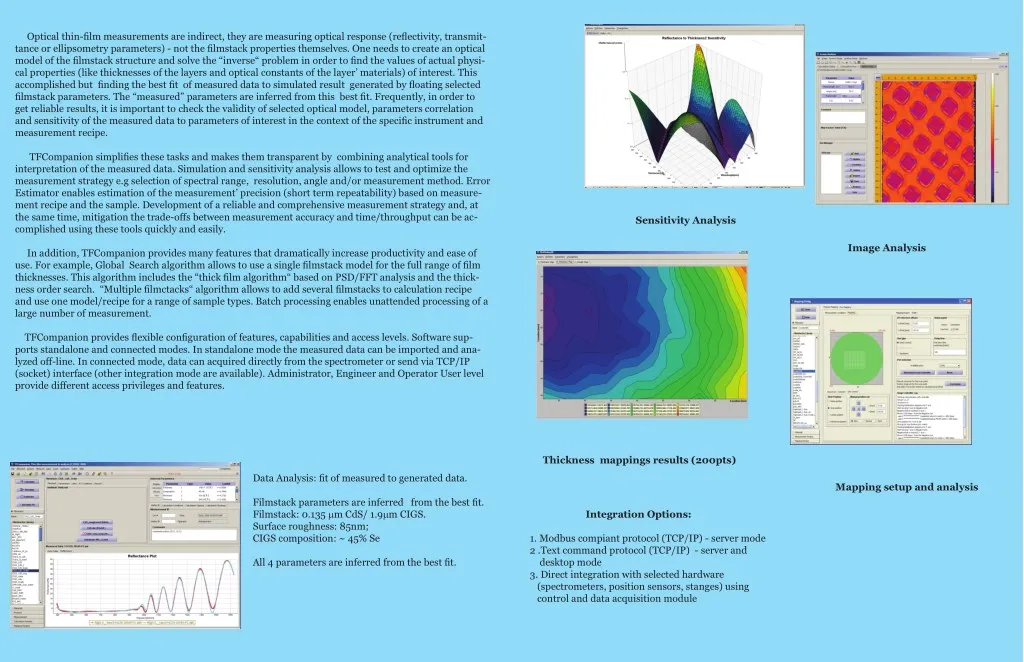
Optical thin-film measurements are indirect, they are measuring optical response (reflectivity, transmit- tance or ellipsometry parameters) - not the filmstack properties themselves. One needs to create an optical model of the filmstack structure and solve the “inverse“ problem in order to find the values of actual physi- cal properties (like thicknesses of the layers and optical constants of the layer’ materials) of interest. This accomplished but finding the best fit of measured data to simulated result generated by floating selected filmstack parameters. The “measured” parameters are inferred from this best fit. Frequently, in order to get reliable results, it is important to check the validity of selected optical model, parameters correlation and sensitivity of the measured data to parameters of interest in the context of the specific instrument and measurement recipe. TFCompanion simplifies these tasks and makes them transparent by combining analytical tools for interpretation of the measured data. Simulation and sensitivity analysis allows to test and optimize the measurement strategy e.g selection of spectral range, resolution, angle and/or measurement method. Error Estimator enables estimation of the measurement’ precision (short term repeatability) based on measure- ment recipe and the sample. Development of a reliable and comprehensive measurement strategy and, at the same time, mitigation the trade-offs between measurement accuracy and time/throughput can be ac- complished using these tools quickly and easily. Sensitivity Analysis Image Analysis In addition, TFCompanion provides many features that dramatically increase productivity and ease of use. For example, Global Search algorithm allows to use a single filmstack model for the full range of film thicknesses. This algorithm includes the “thick film algorithm“ based on PSD/FFT analysis and the thick- ness order search. “Multiple filmctacks“ algorithm allows to add several filmstacks to calculation recipe and use one model/recipe for a range of sample types. Batch processing enables unattended processing of a large number of measurement. TFCompanion provides flexible configuration of features, capabilities and access levels. Software sup- ports standalone and connected modes. In standalone mode the measured data can be imported and ana- lyzed off-line. In connected mode, data can acquired directly from the spectrometer or send via TCP/IP (socket) interface (other integration mode are available). Administrator, Engineer and Operator User level provide different access privileges and features. Thickness mappings results (200pts) Data Analysis: fit of measured to generated data. Mapping setup and analysis Filmstack parameters are inferred from the best fit. Filmstack: 0.135 mmCdS/ 1.9mm CIGS. Surface roughness: 85nm; CIGS composition: ~ 45% Se Integration Options: 1. Modbus compiant protocol (TCP/IP) - server mode 2 .Text command protocol (TCP/IP) - server and desktop mode 3. Direct integration with selected hardware (spectrometers, position sensors, stanges) using control and data acquisition module All 4 parameters are inferred from the best fit.
Feature Standard Version Advanced Version Comment TFCompanion Simulation: Simulation of optical response as a function of Wavelength, Angle and filmstack pa- rameters Simulation: Sensitivity to wavelength, angle and any filmstack parameter Simulation : Simulation of finite wavelength and angle resolution Software for Thin Film Analysis Supports Spectroscopic and Imaging Ellipsometry, Reflectance and Transmittance data analysis Calculation: Modifies Marquardt-Levenberg (global) method Calculation: Thick film algorithm (PSD/FFT) Three main functions: Calculate: Determine filmstack parameters based on measured data Extensive materials library (500+ materials); new materials can be easily added or imported Typically for dielectic ma- terials thickness>3um One recipe for wide range of parameters variation Determine optical rough- ness Thick transparent sub- strate Calculation: Multi-filmstack calculation strategy Wide range of parameterized material types to represent dispersion of dielectric, semicon- ductors, metals and compound materials: from Cauchy and EMA to Drude-Lorentz and Cody- Lorentz-Urbach Surface roughness, scaling and offset correction Simulate: Measurement sensitivity to and optical response from filmstack Calculation: Backside reflection/Incoherent layer Estimate: Measurement precision/repeat- ability and optimize measure ment recipe Calculation: Inhomogeneous layer(optical proper- ties profile) Calculation: Multi sample calculation Advanced features that include Calculation Strategy, Global Search and Thick Film Algo- rithm enable the use of one recipe for wide range of filmstacks Flexible: Calculation: Batch calculation Calculation: Linked layers and materials Repeated layers in hetero- scrtuctures, etc. Data Imported from files, transferred over TCP/IP or directly acquired from spectrometer Supports Windows, Linux and Mac OS “Preflight“ Error Estimate check allows optimi- zation of the measurement strategy. Parameters Correlation and Confidence Intervals informa- tion guides the data analysis optimization Materials: Tabular (NK table) and selected param- etrized materials: Cauchy(3 types), Sellmeier(2 types), EMA (2 ands 3 constituents) Desktop or server mode Materials: Parameterized materials (Lorentz, Drude-Lorentz,,Code-Lorentz,Tauc -Lorentz, Cody-Lorentz-Urbach,Exciton, Afromovitz,Classical oscillators, Binary com- pound) Materials: Extended materials Database Materials: Import/Export of the materials Materials: Tabular/Parameterized materials fit/ conversion Semiconsoft, Inc, 2012 tel. +1.617.388.6832 email: info@semiconsoft.com fax.+1.508.858.5473 http://www.semconsoft.com 10 x 10 um etched pattern in SiO2 (Imaging Ellipsometry) LiNbO3 stack (5 layers)