Download
1 / 14
140 likes | 253 Views
Star Formation and H 2 in Damped Ly a Clouds. Hiroyuki Hirashita (University of Tsukuba, Japan). Contents:. Damped Ly a Clouds (DLAs) Physical State of Gas Getting a Realistic H 2 Distribution Summary. Damped Ly a cloud Ly a absorption. QSO. 1. Damped Ly a Clouds (DLAs).

E N D
Star Formation and H2 in Damped Lya Clouds Hiroyuki Hirashita (University of Tsukuba, Japan)
Contents: • Damped Lya Clouds (DLAs) • Physical State of Gas • Getting a Realistic H2 Distribution • Summary
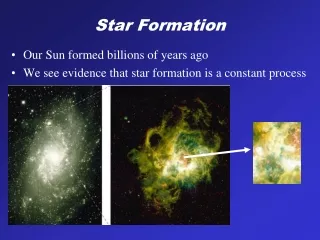
Damped Lya cloud Lya absorption QSO 1. Damped Lya Clouds (DLAs) • High H I column density (> 2×1020 cm–2) Reservoir of a large amount of H I ⇒progenitors of nearby large galaxies? • Unique objects at high z for detailed study ISM by using various species.
Search for H2 and Dust in DLAs • Molecular hydrogen (H2) • The most abundant molecule in the Universe • Tracer of star-forming places • Dust • Formation of H2 on the surface • Shielding of UV and reprocess into IR
Large scatter Correlation: Dust and H2 in DLAs Ledoux, Petitjean, & Srianand (2003) Correlation between dust abundance and molecular fraction. log (molecular fraction) log (molecular fraction) H2 is not detected. metal depletion log (dust/gas)
2. Physical State of Gas Hirashita & Ferrara (2005) Analysis of H2 detected DLAs J = 0, 1 J =4, 5 Dust-to-gas ratio H2 fraction T n H2 formation rate || + H2 destruction rate UV field 30 < n < 300 cm–3 30 < T < 300 K 3 < UV/UV(Galactic) < 30 “cold phase”
H2 destruction (dissociation) self-shielding effect included s–1 Abel et al. (1998) H2 Formation and Destruction H2 formation on dust 4×10–17(D/0.01) S (Tgas, Tdust) cm3 s–1 Hollenbach & McKee (1979) Assumption: H2 abundance is in equilibrium i.e. molecular fraction ∝ D, j(UV)
log (H2 fraction) log (dust-to-gas ratio) 30 < n < 300 cm–3 3 < c < 30 30 < T < 1000 K Likelihood of Cold Phase High density and low UV Low density and high UV H2 forms in gas phase.
Star Formation Rate 3 < UV/UV(Galactic) < 30 SFR surface density = 0.005 – 0.05 Msun/yr/kpc2 Typical radius = 3 kpc (e.g. Kulkarni et al. 2000) SFR = 0.1 – 1 Msun/yr Similar to spirals or dwarfs
3. Getting a Realistic H2 distribution Hirashita et al. (2003) ◆Numerical calculation (2D, vcir = 100 km/s, zform = 3) Temperature Density 1 kpc
Spatial Distribution of H2 log (molecular fraction) Included physics on H2: (1) Formation on grains (2) Dissociation by UV (+self-shielding) (1) = (2) i21 = 0.1, D = 0.1Dsun 50 pc Highly inhomogeneous (confined in clumpy regions)
Severe dust extinction? “Observations” of Simulated Galaxies Select random lines of sight • Overall correlation • Rapid increase of f H2around log(D/Dsun) ~ –1.5. (←self-shielding) • Large scatter for high D log (molecular fraction) ×: Ledoux et al. (2003) ◆: our simulation log (dust-to-gas ratio)
Search for NIR H2 Lines in GRBs Hirashita et al. (2005) Less affected by extinction Dense molecular clouds may be directly detected Typical flux of GRB afterglows Dust-to-gas ratio ~ 1/100 of MW
4. Summary • Our simulations of H2distribution reproduce • Overall correlation between dust/gas ratio and H2 fraction • Clumpy H2 rich regions (⇒ lack of H2 detection) • Effect of self-shielding (⇒ large variation of H2 fraction) • Our likelihood analysis shows • The cold phase suggested by H2 detected objects covers all the data in the likely range. • The upper limit data are consistent also with the warm phase. • Star formation rate is ~ 0.1 – 1 Msun/yr.