Download
1 / 65
660 likes | 854 Views
Shale Gas Production via Hydraulic Fracturing Modified from AOSC 433/633 & CHEM 433/633. Ross Salawitch & Tim Canty Russ Dickerson. ▪ Overview of shale gas production via horizontal drilling and hydraulic fracturing (aka fracking) ▪ Concerns about shale gas production: − Earthquakes

E N D
Shale Gas Production via Hydraulic FracturingModified from AOSC 433/633 & CHEM 433/633 Ross Salawitch & Tim Canty Russ Dickerson ▪ Overview of shale gas production via horizontal drilling and hydraulic fracturing (aka fracking) ▪Concerns about shale gas production: − Earthquakes − Contamination of ground water − Air quality (surface O3 precursors and PM2.5) − Climate (fugitive release of CH4)
Simpson et al., Nature 2012 Is natural gas really better for global climate than coal?
Flight track color coated with CO2 mixing ratio [CO2]-350 ppm
Test flights for Picarro CH4 /CO2 analyzer on 8/15/2013 AM spiral up AM spiral down PM spiral down PM spiral up
CH4 vertical profiles over Millington, rural eastern MD 8/15/2013 PM descent ~ 15 km to NE
CO2 vertical profiles over MD1 (Millington, MD) on 8/15/2013
From NASA’s DISCOVER-AQ July 2011 CH4 looks like a pollutant.
But sometimes CH4 looks like a product of wetland forest activity
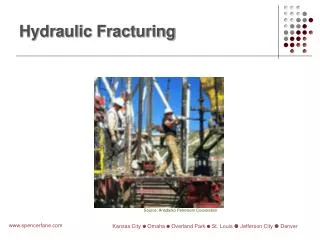
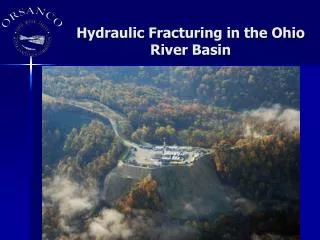
Hydraulic Fracturing ▪Pumping of chemical brine to loosen deposits of natural gas from shale ▪ Extraction of CH4 from shale gas became commercially viable in 2002/2003 when two mature technologies were combined: horizontal drilling and hydraulic fracturing ▪High-pressure fluid is injected into bore of the well at a pressure that fractures the rock Shale gas fracturing of 2 mile long laterals has been done for less than a decade Image: http://www.propublica.org/images/articles/natural_gas/marcellus_hydraulic_graphic_090514.gif
A hydraulic fracturing natural gas drilling rig on the Eastern Colorado plains. In 2009 there were more than 38,000 natural gas wells in the state of Colorado. Weinhold, Envir. Health Perspective, 2012: http://ehp.niehs.nih.gov/120-a272/
Storage tank of fracking well, Longmont, Colorado http://www.timescall.com/portlet/article/html/imageDisplay.jsp?contentItemRelationshipId=4995872
Proppant: solid material, typically treated sand or man-made ceramic materials, designed to keep an induced hydraulic fracture open Image: http://online.wsj.com/article/SB10001424052702303491304575187880596301668.html
Lower 48 Hydraulic Fracturing Geography http://photos.state.gov/libraries/usoecd/19452/pdfs/DrNewell-EIA-Administrator-Shale-Gas-Presentation-June212011.pdf
Shale Gas Production Figure: http://www.eia.gov/pressroom/presentations/sieminski_07202012.pdf Table: http://www.shalegas.energy.gov/resources/081811_90_day_report_final.pdf
States with Active Natural Gas Production as of 2009 (most states) Weinhold, Envir. Health Perspective, 2012: http://ehp.niehs.nih.gov/120-a272/
Shale Gas provides domestic source to meet U.S. consumer needs 2013 U.S. DOE 90 Day Shale Gas Subcommittee Interim Report (11 Aug 2011) http://www.shalegas.energy.gov/resources/081811_90_day_report_final.pdf
Shale Gas provides domestic source to meet U.S. consumer needs Tight gas: CH4 dispersed within low porosity silt or sand that create “tight fitting” environment; has been extracted for many years using hydraulic fracturing Shale gas: CH4 accumulated in small bubble like pockets within layers sedimentary rock such as shale, like tiny air pockets trapped in baked bread Image: http://www.wintershall.com/en/different-types-of-reserves-tight-gas-and-shale-gas.html
States with Active Natural Gas Production as of 2009 (most states) Weinhold, Envir. Health Perspective, 2012: http://ehp.niehs.nih.gov/120-a272/
Md Active Natural Gas Production Garrett County Map: www.mde.state.md.us/programs/Land/mining/Non%20Coal%20Mining/Documents/www.mde.state.md.us/assets/document/mining/NaturalGasWellLocationMap.pdf Chart: http://www.eia.gov/dnav/ng/hist/na1170_smd_8a.htm
PA Active Natural Gas Production Map: http://www.nature.org/ourinitiatives/regions/northamerica/unitedstates/pennsylvania/explore/marcellus-existing-projected-50pct.jpg Chart: http://www.eia.gov/dnav/ng/hist/na1170_spa_8a.htm
Shale Gas Production & Public Policy ▪U.S. imports very little CH4 (some imports from Canada) ▪ Price of CH4 has fallen by a factor of 2 since 2008 ▪Concerns about shale gas production fall into four categories: − Earthquakes − Contamination of ground water − Air quality (surface O3 precursors and PM2.5) −Climate (fugitive release of CH4) ▪ Former U.S. Dept of Energy Secretary David Chu (served 21 Jan 2009 to 22 April 2013) commissioned two reports from the Shale Gas Subcommittee of the Secretary of Energy Advisory Board (SEAB) to “identify measures that can be taken to reduce the environmental impact and to help assure the safety of shale gas production” ▪ First report (11 Aug 2011) identified 20 action items (see table, next slide) ▪ Second report (18 Nov 2011) outlined recommendations for implementation of action items ▪ Notably absent from the reports is extended discussion of earthquake issue ▪ On 17 April 2012 Reducing Air Pollution from EPA issued new standards for the oil and natural gas industry that will not fully take effect until 1 Jan 2015 http://www.epa.gov/airquality/oilandgas/pdfs/20120417presentation.pdf SEAB Shale Gas Subcommittee Reports: http://www.shalegas.energy.gov/resources/081811_90_day_report_final.pdf http://www.shalegas.energy.gov/resources/111811_final_report.pdf
Shale Gas Production & Public Policy ▪ First report (11 Aug 2011) identified 20 action items http://www.shalegas.energy.gov/resources/081811_90_day_report_final.pdf
Shale Gas Production & Public Policy ▪ First report (11 Aug 2011) identified 20 action items Footnote 25: Extremely small micro-earthquakes are triggered as an integral part of shale gas development. While essentially all of these earthquakes are so small as to pose no hazard to the public or facilities (they release energy roughly equivalent to a gallon of milk falling of a kitchen counter), earthquakes of larger (but still small) magnitude have been triggered during hydraulic fracturing operations and by the injection of flow-back water after hydraulic fracturing. It is important to develop a hazard assessment and remediation protocol for triggered earthquakes to allow operators and regulators to know what steps need to be taken to assess risk and modify, as required, planned field operations. http://www.shalegas.energy.gov/resources/081811_90_day_report_final.pdf
Shale Gas Production & Public Policy ▪ First report (11 Aug 2011) identified 20 action items The Subcommittee shares the prevailing view that the risk of fracturing fluid leakage into drinking water sources through fractures made in deep shale reservoirs is remote. Nevertheless the Subcommittee believes there is no economic or technical reason to prevent public disclosure of all chemicals in fracturing fluids, with an exception for genuinely proprietary information. While companies and regulators are moving in this direction, progress needs to be accelerated in light of public concern. http://www.shalegas.energy.gov/resources/081811_90_day_report_final.pdf
Concern #1: Earthquakes 2012 Seismological Society of America meeting
Concern #1: Earthquakes Ellsworth’s study area: http://www.esa.org/esablog/ecology-in-the-news/increase-in-magnitude-3-earthquakes-likely-caused-by-oil-and-gas-production-but-not-fracking
Concern #1: Earthquakes Ellsworth’s study suggests: ▪Deep waste water injection wells are the culprit, especially if in the vicinity of a fault ▪ Increased fluid pressure in pores of the rock can reduce the slippage strain between rock layers ▪Speed of pumping is important (slow better than fast) ▪ On 19 June 2012, Dr. William Leath of the U.S. Geological Survey testified before the U.S. Senate Committee on Energy and Natural Resources, stating: The injection and production practices employed in these technologies have, to varying degrees, the potential to introduce earthquake hazards Since the beginning of 2011 the central and eastern portions of the United States have experienced a number of moderately strong earthquakes in areas of historically low earthquake hazard. These include M4.7 in central Arkansas on Feb27, 2011; M5.3 near Trinidad, Colorado on Aug 23, 2011; M5.8 in central Virginia also on Aug 23, 2011; … M5.6 in central Oklahoma on Nov 6, 2011 … and M4.8 in east Texas on May 17, 2012. Of these only the central Virginia earthquake is unequivocally a natural tectonic earthquake. In all other cases, there is scientific evidence to at least raise the possibility that the earthquakes were induced by wastewater disposal or other oil- and gas-related activities. USGS scientists documented a seven-fold increase since 2008 in the seismicity of the central U.S., an increase largely associated with areas of wastewater disposal from oil, gas & coalbed methane production USGS testimony: First three bullets: http://www.esa.org/esablog/ecology-in-the-news/increase-in-magnitude-3-earthquakes-likely-caused-by-oil-and-gas-production-but-not-fracking USGS testimony: http://www.usgs.gov/congressional/hearings/docs/leith_19june2012.DOCX
Concern #1: Earthquakes Ellsworth’s study suggests: ▪Deep waste water injection wells are the culprit, especially if in the vicinity of a fault ▪ Increased fluid pressure in pores of the rock can reduce the slippage strain between rock layers ▪Speed of pumping is important (slow better than fast) ▪ On 19 June 2012, Dr. William Leath of the U.S. Geological Survey testified before the U.S. Senate Committee on Energy and Natural Resources, stating: The injection and production practices employed in these technologies have, to varying degrees, the potential to introduce earthquake hazards Since the beginning of 2011 the central and eastern portions of the United States have experienced a number of moderately strong earthquakes in areas of historically low earthquake hazard. These include M4.7 in central Arkansas on Feb27, 2011; M5.3 near Trinidad, Colorado on Aug 23, 2011; M5.8 in central Virginia also on Aug 23, 2011; … M5.6 in central Oklahoma on Nov 6, 2011 … and M4.8 in east Texas on May 17, 2012. Of these only the central Virginia earthquake is unequivocally a natural tectonic earthquake. In all other cases, there is scientific evidence to at least raise the possibility that the earthquakes were induced by wastewater disposal or other oil- and gas-related activities. USGS scientists documented a seven-fold increase since 2008 in the seismicity of the central U.S., an increase largely associated with areas of wastewater disposal from oil, gas & coalbed methane production USGS testimony: See also: Frohlich, Two-year survey comparing earthquake activity and injection-well locations in the Barnett Shale, Texas, PNAS, 2012http://www.pnas.org/content/early/2012/07/30/1207728109.full.pdf+html which reaches similar conclusions
Concern #2: Water Quality http://savethewater.org/wp-content/uploads/2013/02/Stock-Save-the-water-New-Study-Predicts-Fracking-Fluids-Will-Seep-Into-Aquifers-Within-Years.jpg
Concern #2: Water Quality Spread of contaminants in ground water determined by Dispersion – differential flow of water through small openings (pores) in soil Diffusion – random molecular (Brownian) motion of molecules in water very slow in condensed phase. Sorption – some chemicals may be absorbed by soil while others are adsorbed (adhere to surfaces) Highly diffusive chemicals (e.g. MTBE) can spread very quickly even though ground water is relatively motionless. http://toxics.usgs.gov/topics/gwcontam_transport.html
Concern #2: Water Quality Benzene? http://www.exxonmobilperspectives.com/2011/08/25/fracking-fluid-disclosure-why-its-important/
Concern #2: Water Quality http://www.tandfonline.com/doi/pdf/10.1080/10807039.2011.605662 http://www.exxonmobilperspectives.com/2011/08/25/fracking-fluid-disclosure-why-its-important/ Many chemicals used in fracking have “everyday” uses … We control how chemicals are used in homes, not the case for fracking
Concern #2: Water Quality Fluid composition: April 2011: www.fracfocus.org created as central disclosure registry for industry use Currently, official disclosure venue for 10 states (Colorado, Louisiana, Mississippi, Montana, North Dakota, Ohio, Oklahoma, Pennsylvania, Texas, Utah) Searchable database & Google map interface allow user to obtain info for individual wells
Concern #2: Water Quality Fluid composition: April 2011: www.fracfocus.org created as central disclosure registry for industry use Currently, official disclosure venue for 10 states (Colorado, Louisiana, Mississippi, Montana, North Dakota, Ohio, Oklahoma, Pennsylvania, Texas, Utah) Searchable database & Google map interface allow user to obtain info for individual wells
Concern #2: Water Quality Fluid composition: April 2011: www.fracfocus.org created as central disclosure registry for industry use Currently, official disclosure venue for 10 states (Colorado, Louisiana, Mississippi, Montana, North Dakota, Ohio, Oklahoma, Pennsylvania, Texas, Utah) Searchable database & Google map interface allow user to obtain info for individual wells • Recent study by Harvard Law highlights flaws in this system: • Timing of Disclosures: Site does not notify States if company submits late • Substance of Disclosure: Site does not provide state specific forms, no minimum reporting standards • Nondisclosures: Companies not required to disclose chemicals if they are considered a “trade secret” • ~20% of all chemicals not reported. • http://www.eenews.net/assets/2013/04/23/document_ew_01.pdf
Concern #2: Water Quality Research in progress: • Isotopic analysis of sites in Pennsylvania indicate levels of CH4 in wells near (< 1km) drilling sites 17 times higher than sites further away, Osborn et al. (PNAS, 2011) • Independent analysis of these sites suggests elevated CH4 due to topography rather than fracking, Molofsky et al. (Oil Gas J., 2011), no evidence of fracking fluid in wells, Schon (PNAS, 2011) • Continued (unpublished) research supports notion that CH4 in wells due to nearby drilling sites, Vengosh et al. (PEPS, 2013) • Surface water quality degraded through release from treatment facilities (increases Cl–) and through release from wells (increases total suspended solids), Olmstead et al. (PNAS, 2012)
Concern #3: Air Quality (Case Study 1: Wyoming) http://deq.state.wy.us/out/downloads/UGRBTaskForce02212012WDEQAQD.pdf
Concern #3: Air Quality (Case Study 1: Wyoming) http://deq.state.wy.us/out/downloads/March22PublicMtg_2011Ozone_WDEQ.pdf
Concern #3: Air Quality (Case Study 1: Wyoming) http://deq.state.wy.us/out/downloads/March22PublicMtg_2011Ozone_WDEQ.pdf
Concern #3: Air Quality (Case Study 1: Wyoming) http://deq.state.wy.us/out/downloads/March22PublicMtg_2011Ozone_WDEQ.pdf
Concern #3: Air Quality (Case Study 1: Wyoming) Chart: http://www.eia.gov/dnav/ng/hist/na1170_swy_8a.htm http://deq.state.wy.us/out/downloads/March22PublicMtg_2011Ozone_WDEQ.pdf
Concern #3: Air Quality (Case Study 1: Wyoming) http://www.shalegas.energy.gov/resources/071311_corra.pdf
Concern #3: Air Quality (Case Study 1: Wyoming) http://www.shalegas.energy.gov/resources/071311_corra.pdf
Concern #3: Air Quality (Case Study 1: Wyoming) http://deq.state.wy.us/out/downloads/March22PublicMtg_2011Ozone_WDEQ.pdf
Concern #3: Air Quality (Case Study 2: Maryland) • Washington County contains ~10% of PA’s Marcellus wells • Charleroi lies at the eastern edge of drilling operations (downwind) • Drilling rights granted by residents at the end of 2008 NO2 trends for summer time only Satellite Data Surface Data Tim Vinciguerra et al., in preparation, 2013
Concern #3: Air Quality (Case Study 2: Maryland) • Washington County contains ~10% of PA’s Marcellus wells • Charleroi lies at the eastern edge of drilling operations (downwind) • Drilling rights granted by residents at the end of 2008 HCHO (formaldehyde) rising more rapidly post 2009 Satellite Data Tim Vinciguerra et al., in preparation, 2013
Concern #3: Air Quality (Case Study 2: Maryland) • Washington County contains ~10% of PA’s Marcellus wells • Charleroi lies at the eastern edge of drilling operations (downwind) • Drilling rights granted by residents at the end of 2008 Surface O3 during summer also rising since 2009 Surface Data Tim Vinciguerra et al., in preparation, 2013