Download
1 / 47
470 likes | 577 Views
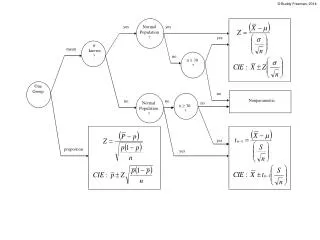
Interval Estimation of the Population Mean for a Normal Population with s Unknown. Student’s t-distribution. If s is not known and n 30, the derivation of the confidence interval must be changed slightly.

E N D
Interval Estimation of the Population Mean for a Normal Population with s Unknown
Student’s t-distribution • If s is not known and n 30, the derivation of the confidence interval must be changed slightly. • Provided the population from which the sample is drawn is normally distributed, the distribution of the quantity • has a Student’s t-distribution, which was discovered by W. S. Gossett in 1908.
Degrees of Freedom • The t-distribution has one parameter, degrees of freedom. • Degrees of freedom for any t-distribution is computed in the following manner d.f. = n - 1, • where n is the number of sample observations.
Shape of the t-distribution • The t-distribution is very much like the normal; it is a symmetrical, bell-shaped distribution with slightly larger tails than a normal. • In fact, as the degrees of freedom become larger, the t-distribution approaches the normal distribution. normal t
Confidence Interval for the Population Mean Definition: If n 30, s is unknown, and the sample is drawn from a normal population, a (1 - a) confidence interval for the population mean is given by where is the critical value for a t-distribution with n - 1 degrees of freedom which captures an area of a/2 in the right tail of the distribution.
Example 5 Construct an 80% confidence interval for the mean of a normal population assuming that the values listed below comprise a random sample taken from the population. 83.9 87.4 65.2 86.0 73.1 80.3 92.7 87.5 69.3 77.5 91.9 71.1 79.1 72.4 88.2 The population standard deviation is unknown.
Example 5 - Solution We are given: X has a normal distribution, the variance is unknown, n = 15, and the confidence level = .80.
1 - a = .80 a = .20 Example 5 - Solution .40 .40 .80 .10 .10
Example 5 - Solution We must calculate = 80.37 and s = 8.68. We want to determine an 80% confidence interval for the mean. Since X is normal, s is unknown and n 30, the confidence interval is given by
Precision • The best interval estimates a decision maker could hope for would be those which are very small in size and possess a large amount of confidence. • The width of the confidence interval defines the precision with which the population mean is estimated; the smaller the interval the greater the precision.
Components Which Affect the Width • Note: The entire confidence interval • width = 2 . • represents the distance the confidence interval boundary is from the mean in standard deviation units. The distance is related to the specified level of confidence. • s represents the population standard deviation. • n represents the sample size.
Which component can change? • Since the population standard deviation (s) is a constant, it does not change. • However, the sample size, n, is selected by the decision maker. • Since the sample size can enlarge or reduce the width of the confidence interval, how large should the sample be?
Error • The sample size should be selected in relation to the size of the maximum positive or negative error the decision maker is willing to accept. • This can be achieved by setting the error equal to one half the confidence interval width,
Determining the Sample Size • The equation for error can be solved for the sample size, • By selecting a level of confidence and the maximum error, the relationship can be used to determine the sample size necessary to estimate the sample mean with the desired accuracy. • In order to assure the desired level of confidence, always round the value obtained for the sample size up to the next whole integer.
Example 6 A computer software company would like to estimate how long it will take a beginner to become proficient at creating a graph using their new spreadsheet package.
Example 6 • Past experience has indicated that the time required for a beginner to become proficient with a particular function of new software products has an approximately a normal distribution with a standard deviation of 15 minutes. • Find the sample size necessary to estimate the average time required for a beginner to become proficient at creating a graph with the new spreadsheet package to within 5 minutes with 95% confidence.
Example 6 - Solution We are given: s = 15, error = E = 5, and the confidence level = .95.
Example 6 - Solution a = .05 .475 .025 1 - a = .95
Example 6 - Solution We want to determine the sample size necessary to estimate the mean time required for a beginner to become proficient at creating a graph with the new spreadsheet package. The sample size is given by To get the desired accuracy, we must round up to 35.
Sample Size for s Unknown • The most obvious method for obtaining an estimate of s is to take a small sample and use the sample standard deviation as an estimate of the population standard deviation. • Replacing s with s in the sample size determination relationship will provide an initial estimate of the required sample size.
Attribute • An attribute is a characteristic that members of a population either do or do not possess. • Attributes are almost always measured as the proportion of the population that possess the characteristic. • Example: • An attribute of a person would be whether they smoke cigarettes or not. • p = proportion of the population which smoke cigarettes
Estimating the Proportion • Estimating the proportion of the population that possesses an attribute is straightforward. • A random sample is selected and the sample proportion is computed as follows: X = number in the sample that possess the attribute, n = sample size, and
Example 7 The Richland Gazette, a local newspaper, conducted a poll of 1,000 randomly selected readers to determine their views concerning the city's handling of snow removal. The paper found that 650 people in the sample felt the city did a good job.
Example 7 Compute the best point estimate for the percentage of readers who believe the city is doing a good job in snow removal.
Example 7 - Solution X = number of people who believe the city is doing a good job X = 650 n = number of randomly selected readers n = 1000
Sampling Distribution of the Point Estimate • In order to develop the confidence interval for a population proportion the sampling distribution of the point estimate must be developed. • The random variable, , has a binomial distribution which is approximated with a normal random variable.
The Sample Proportion • The sample proportion, , is distributed normally with mean, p, and variance, .
The Sample Proportion • The standard deviation of the sample proportion ( ) is denoted symbolically as and is given by • where is used as an estimate of p if the population proportion is unknown.
Confidence Interval for the Population Proportion Definition: If the sample size is sufficiently large, np 5 and n(1-p) 5, the 1 - a confidence interval for the population proportion is given by the expression where is the distance from the point estimate to the end of the interval in standard deviation units, and is the standard deviation of .
Example 8 The Peacock Cable Television Company thinks that 40% of their customers have more outlets wired than they are paying for. A random sample of 400 houses reveals that 110 of the houses have excessive outlets.
Example 8 Construct a 99% confidence interval for the true proportion of houses having too many outlets. Do you feel the company is accurate in its belief about the proportion of customers who have more outlets wired than they are paying for?
Example 8 - Solution We are given: X = number of houses that have excessive outlets = 110, n = 400, and the confidence level = .99. Thus,
Example 8 - Solution .495 .005 1 - a = .99 a = .01
Example 8 - Solution A 99% confidence interval for the true proportion of houses having too many outlets is given by
Example 8 - Solution • Interpretation: We are 99% confident that the true proportion of houses having too many outlets is between .2175 and .3325. • Note: We do not believe that 40% of customers have more outlets wired than they are paying for because we are 99% confident that the true proportion is in the interval 21.75% to 33.25% and 40% isnot in that interval.
Accuracy in Estimating a Population Proportion • Just as for the population mean, a specific level of accuracy in estimating a population proportion is desirable. • When we estimate extremely small quantities, highly precise estimates are necessary.
Deriving the Sample Size • The technique for deriving the sample size parallels the discussion of the sample mean. • Setting one half the entire width of the confidence interval equal to the maximum allowable error yields • error = • Solving for n yields • n =
Sample Size when is Known • Generally the population proportion is unknown and is estimated from a pilot study. • In this case, the sample size necessary to estimate the population proportion to within a particular error with a certain level of confidence is given by n = • where is the estimate obtained from the pilot study.
Sample Size when is Unknown • If an estimate of the population proportion is not available, then the population proportion is set equal to .5 and the sample size is given by n = • The value .5 maximizes the quantity p(1 - p) and thus provides the most conservative estimate of the sample size.
Example 9 Researchers working in a remote area of Africa feel that 40% of the families in the area are without adequate drinking water either through contamination or unavailability. What sample size will be necessary to estimate the percent without adequate water to within 5% with 95% confidence?
Example 9 - Solution We are given: , error = E = .05, and the confidence level = .95.
a = .05 .475 .025 Example 9 - Solution 1 - a = .95
Example 9 - Solution We want to determine the sample size necessary to estimate the proportion of families in the area without adequate drinking water. Since we have an estimate of , the sample size is given by To get the desired accuracy, we must round up to 369 families.