Download
1 / 17
170 likes | 363 Views
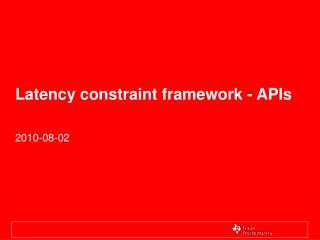
CPU Sizing vs. Latency Analysis FTS EDR Latency Simulation. 5 March 2008 Doug Shannon. Contents. FTS Latency – Simulation & Analyses IDPS NPP Status ATDS/FTS Simulation Overview Example Simulation Results ATDS/FTS Demo FTS HRD/LRD Latency Requirements:

E N D
CPU Sizing vs. Latency Analysis FTSEDRLatency Simulation 5 March 2008 Doug Shannon
Contents • FTS Latency – Simulation & Analyses • IDPS NPP Status • ATDS/FTS Simulation Overview • Example Simulation Results • ATDS/FTS Demo • FTS HRD/LRD Latency Requirements: • SYS013230 The LRD Field Terminal software, when installed on NPOESS representative hardware, shall produce Imagery EDRs within 2 minutes and all other EDRs specified in Appendix G within 15 minutes of receipt of mission data. Class 2 • SYS013235 The HRD Field Terminal software, when installed on NPOESS representative hardware, shall produce Imagery EDRs within 2 minutes and all other EDRs specified in Appendix E, except for EDRs 40.3.1.4, 40.4.10, 40.7.5, and 40.7.8, within 15 minutes of receipt of mission data. Class 2
IDPS NPP Status • IDPS NPP Build 1.5 • 1 orbit NPP processing (101 mins) – 53 mins • Meets EDR latencies (117.2 mins for 140 mins requirement) • Major speedups in DMS performance • Algorithm development & integration “95%complete” • Future Builds 1.5.x.1 (3Q 08), B1.5.x.2 (2Q 09). • OMPS, NHF, combined Albedo, Bright Pixel • Move LSA Granulation out of VIIRS SDR (1.5.x.1) to improve IMG latency • ATDS/FTS getting new benchmarks on B1.5 algorithms • Faster processing? • Less algorithm sensitivity to scene content?
Algorithm Timing & Dependency Simulation Field Terminal Latency Analyses • ATDS supports NPP, NPOESS/NPP & NPOESS performance analyses • FTS latency simulations differences: • Receives C1/C2 LRD or HRD in real time; no stored data • Sensors collect at 9.1 & 5.0 Mbps (average day/night) • Various FTS locations and weather/terrain conditions • Smaller EDR granules (NPP 85.7sec & NPOESS 42.9sec) • Processing Architecture - • Split SDR - generate IMG sooner, after SDR Cal/Geo, before granulation • Pre-load SDR static ancil/aux tiles (TBD) to reduce latency • Assume no/minimal cross-granule dependency
VIIRS Cross-Granule Latency Tiers +3 SDR +2 +4 +5 +1 +3 +4 +2 +3 +4 +5
FTS Simulation (e.g. Omaha):2 day 19 Passes with NPOESS S/C Contact Durations: Max 13.1 mins Avg 10.5 mins Min 2 mins? <4mins 2.3% 13301730 FTS Contacts with NPOESS S/C (1440 minutes = 1 days)
Scene in VIIRS View Ocean Cloudy Snow/Ice Orbital Position Defines Dynamic Scene Content in Sensor Data Orbital Position defines Sensor Nadir NCEP Weather Data Base Dynamic Processing
Impact of Weather/Terrain on FTS Data • Algorithm loading for Clear-Ocean is heaviest,21% over average. • NCEP weather DB for Spring 2003 • 90-100% ocean – 41% • 90-100% clear – 8% • Clear & Ocean – 3% • User can’t select his weather/terrain • ATSD can analyze user FTS locations & helpsize for field conditions >90% Clear >90% ocean
Algorithm, Timing & Dependency Simulator:FTS IDPS and Algorithm Models S/W Science Algorithms H/W
Example ATDS Simulation results – Omaha FTS scenario • Peak demand (17 CPUs) not equal to CPU requirement. • 2.6 GHz CPUs • CPU resources driven by contact length & S/C sensors. • No ATMS & CrIS on C2
Example ATDS Simulation results – Omaha FTS scenario • EDR latencies are dynamic as scene content varies • Shows last VIIRS EDR for multiple granules
Example ATDS Simulation results – Omaha FTS scenario • Latencies varied 1.5 – 7.7 mins • Imagery latency ~3.3 mins FTS IMG
On-going ATDS/FTS Trades • Variable number of CPUs & processor speeds • Smaller VIIRS/CrIMSS granules • Science implications for processing areas and adjacency. • Weather/Terrain impact on IDPS Latency • Various FTS locations • Various weather & terrain conditions • SDR architectural trades • Selectable EDR configurations • HRD vs LRD algorithms • Generate high priority top EDRs only • Generate Imagery only
VIIRS HRD vs LRD Algorithm Processing 11% 10% 2% 0.3% 14%/10 2% 26% 9% 1% 5% 5%
Summary • Due to algorithm scene sensitivity, highly variable weather/terrain are significant factors for latency and CPUs required. • Some new IDPS benchmarks show less than expected sensitivity. • Ongoing IDPS algorithm optimization are improving FTS latencies. • Improvements to IDPS Infrastructure (DMS) are very good but don’t apply directly to FTS. • We continue to add fidelity to our ATDS simulations, bounding nominal performance against worst-case scenarios in order to quantify system processor needs.
Backups • 2005 back-to-back S/C contacts and gap analysis
Gap Time Between Contacts Max gap is 2.1 orbits at equator Analyzed STK 1330/1730/2130 contact data Back-to-back S/C Contacts • Overlapping S/C contacts don’t occur due to spacecraft orbital phasing. • Smallest gap of 10.2 minutes has minimal impact to FTS latency. • Above 60N there is a large increase in contacts and EDRs. 60N