Download
1 / 35
350 likes | 475 Views
3rd Annual Cancer Care Engineering Retreat. Systems Approaches to Colorectal Cancer Care. Stephen D. Roberts Brian Denton Reha Uzsoy Edward P. Fitts Department of Industrial and Systems Engineering North Carolina State University Raleigh NC, USA. About 150,000 people diagnosed each year.

E N D
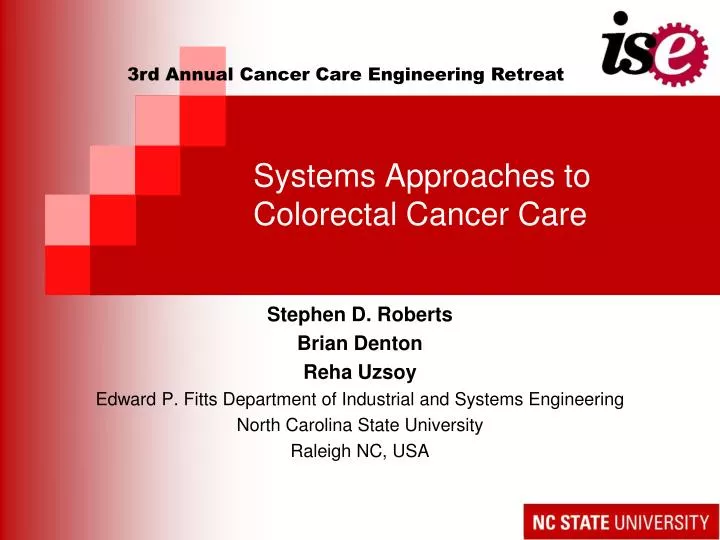
3rd Annual Cancer Care Engineering Retreat Systems Approaches to Colorectal Cancer Care Stephen D. Roberts Brian Denton Reha Uzsoy Edward P. Fitts Department of Industrial and Systems Engineering North Carolina State University Raleigh NC, USA
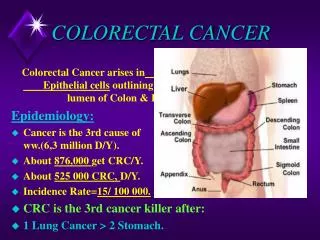
About 150,000 people diagnosed each year Second leading cause of cancer deaths About 90M people considered at risk Colorectal Cancer (CRC)
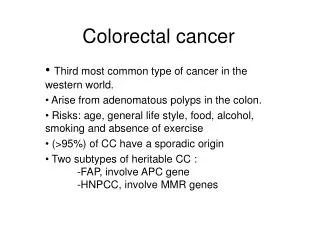
Key Characteristics • Cancer is a disease of the DNA • Usually not symptomatic until advanced • Deadly if not found early • Only 8.5% five-year survival if found late • Over 90% five-year survival if found early • Risk factors include: • Age, race, gender • Personal or Family history • Other related diseases • Lifestyle (?) • Diet (?)
Screening for CRC • Endoscopic Tests • Colonoscopy • Sigmoidoscopy • Non-Endoscopic Tests • Fecal Occult Blood Test (FOBT) • Double Contract Barium Enema (DCBE) • Virtual Colonoscopy • Fecal DNA
Treatment and Intervention • Treatment • Surgery • Resection: removal of “sections” of the colon • Ostomy • Chemotherapy • Radiation • Combination Therapy • Medical Screening Interventions • Accepted Practice • Taught in Medical School (“experts”) • Stated in recognized Medical Literature • Recommended Guidelines • American Cancer Society • American Gastroenterological Society
Systems Engineering for CRC • Ongoing projects at NCSU • Collaborations with • Vanderbilt University • Medical Center and Health Services Research • University of North Carolina Chapel Hill • ShepsCenter for Health Policy Research • Industry • Medical Decision Modeling Inc. • Purdue CCE Project • As of May 2008 • Mayo Clinic
Work to date • Focused on simulation models • Effect of different screening policies on population • Population-level modeling of the natural history • Cost-effectiveness of different screening policies • Effects of system design on the number of people seeking preventive screening • Broader system including access to primary care and screening facilities • Performance of endoscopy suites
Screening Decisions • How “population-centric”? • age, gender, race, family history, compliance? • What screening method? • Endoscopic and non-endoscopic • When to start/stop screening? • Protocol if screen is positive? • Verification and treatment • Protocol if screen is negative? • Time to next screening • When to stop screening
Evaluating medical decisions? • Health burden • Mortality – life years • Morbidity – quality-adjusted life years (QALY) • Cost burden • Cost of intervention • Cost of maintenance and surveillance • Value for cost • Cost-effectiveness (CE): cost per QALY • Cost-benefit (CB): net cost
Modeling Natural History • Fundamentally stochastic • Focus on the individual • Intermediate relevant events • Start of disease (adenoma) • Pathway and Progression • “Natural death” without the disease • Marginal life expectancies • Modify actuarial data (eliminating CRC)
Course of Disease (Natural History) Medical Timeline Birth Death ND A1 CD 0 A2 C1 CO C2 A1 – undetected first Adenoma A2 – undetected second Adenoma C1 – invasive Cancer from A1 C2 – invasive cancer from A2 CO – Colonoscopy/surgery to remove C1 CD – Cancer Death ND – “Natural” Death
Overall Software Design Strategy MedicalProtocolDesign User Interface Simulation Engine Results inExcel Data Objects Scenarios CRCExpertise Report Writer CRC Variables AccessDatabase
Sources of Data • Cancer • National Cancer Institute (SEER) • National Data • Centers for Disease Control (CDC) • National Center for Health Statistics (NCHS) • US Census Bureau Population Estimates • Berkeley Mortality Statistics • Vanderbilt CRC Literature Database • Validated based on Minnesota Colon cancer Control Trial
Results • Can be used to study a variety of aspects of CRC progression and screening • Health and cost burdens of CRC by population • Effects of parameter uncertainty on the cost-effectiveness of treatment options • Cost-effectiveness of different screening options based on willingness to pay for an additional QALY
Result: Effect of Colonoscopy Screening ΔCost (F,B,N - $8,342) $500 (M,B,N - $7,329) Higher (Poorer) Cost-Effectiveness (F,W,N - $4,008) (M,W,N - $2,571) ΔLifeYears (0,0) .100 .160 .040 (F,B,F – Cost-Saving) (M,B,F – Cost-Saving) (F,W,F – Cost-Saving) (M,W,F – Cost-Saving)
Acceptability Curves WTP (λ)
A broader view… • Effective screening significantly reduces the risks of CRC • However, not all patients who could benefit from screening receive it • Estimate an additional 30,000 lives could be saved annually if people would get screened • How to improve the number of people who get screened?
Combined simulation model • Combines discrete event and continuous (system dynamics) aspects • Continuous variables change continuously over time • Level of awareness of CRC risk • Other variables change at discrete points in time • Number of screening facilities • Used ARENA 7.0 software
Continuous component • Uses causal loop representation to capture relationships between quantities of interest • Sterman(2000); Forester(1962) • Nodes represent variables, arcs causal relationships • Signs on arcs represent positive or negative correlation between variables
Simulation of Endoscopy Suites • Collaboration with Brian Denton of NCSU-ISE and Mayo Clinic • Examine the operational and design aspects of endoscopy suites • Clear relevance to the level of screening in the population, cost of providing care
Endoscopy Process • Patient Intake: patient checks-in, administrative activities, gowning, patient roomed • Procedure: endoscopist enters room, patient sedated, colonoscopy starts, polyps removed, patient extubated • Recovery: post anesthesia care unit (PACU), patient discharged Intake Recovery Procedure
Complicating Factors • Many types of resources: endoscopists, nurses, equipment, materials • High cost of resources and fixed time to complete activities • Large number of activities to be coordinated in a highly constrained environment • Uncertainty in duration of activities • Many competing criteria
Model Recovery Area Patient Check-in Waiting Area Patient Discharge Patient Arrivals Preoperative Waiting Area Intake Area Procedure Rooms Dependent (Waiting) Independent (Process) Dependent (Waiting) Independent (Process) Dependent (Waiting) Independent (Process)
General Insights • Economies of Scale: No observed efficiencies in patient throughput due to increasing the number of Ors. Some benefits for up and down stream resources. • Turn-over Times: The impact of reducing turnover times for ORs on all performance measures is limited to staffing scenarios is which endoscopists have 1 or 1.5 ORs. • Utilization: The maximum achievable endoscopist utilization is 90% and the maximum achievable OR utilization is 67%.
Some conclusions • Systems engineering techniques can be deployed effectively to support the CRC care cycle (continuum) • Effective collaboration with health care providers and health services researchers is critical • Data collection to parameterize and validate models is a major effort • Increased networking among researchers will allow us to leverage each others’ efforts
Future directions • Continue to develop and enhance simulation models • Treatment pathways? • Extend from simulation to optimization models • Determine number and location of CRC screening facilities • Explicitly consider demographics, queueing effects of capacity on wait times, travel distances affecting demand • Build on work in supply chain network design with lead time aspects
Validation • Overall Characteristics • SEER Data, Life-Table, Prior Model • Screening Validation: Minnesota Colon Cancer Control Study • Use FOBT relative to no screening (from 1975 through 1977 and followed until 1991 • Randomized trial of three groups: annual screening, biennial screening, and no screening • Simulated population fit to Minnesota trial population • Some parameters had to be modified to be consistent with the inputs reported
Graphical Interpretation:Cost-Effectiveness Plane ΔCost Greater Cost, Greater Effect Greater Cost, Less Effect Unacceptable CE > 0 (0,0) ΔEffect Less Cost, Less Effect Less Cost, Greater Effect Cost Saving
Why Simulation • Not readily Markovian • No geometric or exponential state occupancy • State explosion to achieve memorylessproperty (due to age, gender, race, family history) • Concurrent multiple precursors to CRC • Multivariate and time-dependent processes (depend on person and adenoma state) • Discrete-Event System (variable time updating) • Object-Oriented