Download
1 / 16
160 likes | 347 Views
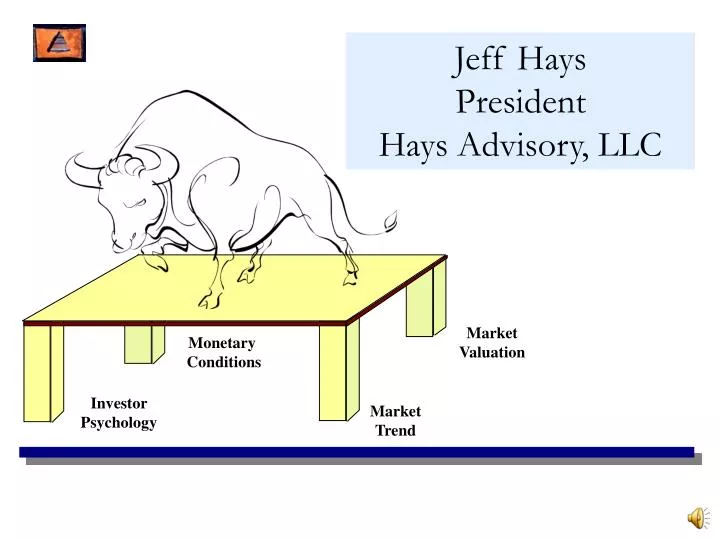
Jeff Hays President Hays Advisory, LLC. Market Valuation. Monetary Conditions. Investor Psychology. Market Trend. Established 1999 in Nashville Independent, Employee-owned Over 40 years of Market/Economic Analysis Disciplined, Long-term investors

E N D
Jeff HaysPresidentHays Advisory, LLC Market Valuation Monetary Conditions Investor Psychology Market Trend
Established 1999 in Nashville • Independent, Employee-owned • Over 40 years of Market/Economic Analysis • Disciplined, Long-term investors • Total Firm AUM: $904 Million (06/09) • Dedicated to client education/communication • Research and commentary: www.haysadvisory.com Hays Advisory • Established 1999 in Nashville • Over 40 years of Market/Economic Analysis • Disciplined, Long-term investors • Total Firm AUM: $904 Million (06/09) • Independent, Employee-owned • Dedicated to client education/communication • Research and commentary: www.haysadvisory.com
Our Long-Term Theme For Success The Technology Revolution produces A Massive New Flat World which ignites A Spread of Democracy which unleashes A Huge Sponge of New Consumption which launches The Greatest Economic Boom In the History of the World which results in Tremendous Global Stock Market Potential For Illustrative Purposes Only. We are not soliciting or recommending any action based upon this material.
ETF Interest Continues Upward Trend Characteristics ETFs Mutual Funds Diversification Benefits Management Fees 12b-1 Fees Intraday Pricing Transparency As Low As 0.07% Average 1.4% Maximum 0.07% Maximum 1% MutualFunds Google Search Trends ETF’s For Illustrative Purposes Only. We are not soliciting or recommending any action based upon this material.
Hays Global and International ETF Portfolios Our Two Pronged Approach to Adding Alpha + Tactical Allocation Portfolio Construction Asset Allocation ETF Universe Ranking ETF Selection Monetary Valuations Investment Committee Investor Psychology Market Trend For Illustrative Purposes Only. We are not soliciting or recommending any action based upon this material.
Asset Allocation Model • Psychology P1-P6 • Fear/Greed, Smart $/Dumb$ • Monetary M1-M6 • Yield Curve, Fed, $ on Sidelines • ValuationV1-V6 • P/E’s , Apprec. Potential, IBES • Market Trend • Investment & Trading Phases provide a technical component to compliment model Market Valuation Monetary Conditions Investor Psychology Market Trend For Illustrative Purposes Only. We are not soliciting or recommending any action based upon this material.
The Hays Global and International Selection Process 800 ETF Category Weighting Domestic and International Broad / Index Sector Specific Industry Specific Regional Country Specific 160 Final ETF Selections Top 20% Of Entire ETF Universe Investment Committee Volume, Diversification, Expense, Technicals Final ETF Portfolio 7-15 Concentrated Positions For Illustrative Purposes Only. We are not soliciting or recommending any action based upon this material.
ETFs: Purchase and Sell Discipline • Similar to the equity portfolios, Hays adheres to a defined buy/sell process in our managed ETF portfolios. Purchase Candidates: Technically favorable Top Relative Strength Top 20% Ranking vs. entire ETF universe Sell Candidates: Underperforming ETFs become flagged as sell candidates when performance falls in bottom 40% of ETF universe (Relative Strength) For Illustrative Purposes Only. We are not soliciting or recommending any action based upon this material.
Hays Global ETF Portfolios For Illustrative Purposes Only. We are not soliciting or recommending any action based upon this material.
Hays Global ETF Portfolio Performance: Annualized Returns* - Inception 2/1/06 QTR*YTD*200820072006*Inception* Global ETF - Net 19.40 15.40 -41.02 14.69 2.59 -6.76 Global ETF -“Pure” Gross** 19.65 15.90 -41.48 15.86 3.53 -5.86 MSCI All Country World 22.54 9.59 -41.85 12.19 15.81 -5.38 MSCI EAFE *** 23.765.63-45.09 8.62 16.29 -8.72 S&P 500 TR *** 15.93 3.17 -36.99 5.50 12.59 -7.31 *All returns for periods less than one year have NOT been annualized. Since inception # is annualized. 2006 return is from 2/1/2006. **“Pure” gross of fees returns are supplemental to net returns. For wrap accounts, “pure” gross of fees returns reflect the deduction of expenses charged by the exchange traded funds but do not reflect the deduction of any other expenses, including trading costs. For non-wrap accounts, which represented 2.9% of the composite assets at the end of the period, “pure” gross of fees returns reflect the deduction of trading costs and expenses charged by the exchange traded funds but do not reflect the deduction of any other expenses. *** The MSCI All Country World Index is the Global Portfolio’s benchmark. We are presenting the S&P & EAFE for comparison only. For Illustrative Purposes Only. We are not soliciting or recommending any action based upon this material. Past performance is no indication of future results. Please see important disclosures at the end of this presentation.
Global ETF Portfolio Performance Disclosures • The recommended asset class portfolio constraints for the Global ETF Composite strategy allow for a client’s portfolio to be invested in as much as 100% ETF equities with a minimum of 50% when market risk rises. While Hays Advisory’s goal is to always adhere to the maximum and minimum constraints, market conditions or other special situations may cause a greater variance. • Global ETF composite assets as of June 30, 2009 were 1.22 million, which represented 0.13% of the firm’s total assets. Less than twenty two percent of the assets in the composite were non-fee paying assets. Returns are calculated in U.S. dollars. • Client’s returns will be reduced by the advisory fees and any other expenses it may incur in the management of its investment accounts. Hays Advisory’s investment advisory fees are described in detail in Part II of its Form ADV. • The market value of Hays Advisory’s portfolios’ investments will fluctuate as the stock and bond markets fluctuate. Market risk may affect a single issuer, industry or sector of the economy or may affect the market as a whole. Stock market conditions vary from year to year, and can result in a decline in market value due to material market or economic conditions. • The net performance results portrayed reflect the deduction of advisory fees and other expenses, which the client would have paid during the periods shown. Prior to 2008, the composite contained a single, non-fee paying account. Net performance results were calculated hypothetically by deducting a 1% annual fee billed at 0.25% per quarter – Hays Advisory’s highest applicable management fee during the period – to reflect what a client may have paid during the periods shown. • The results portrayed reflect the reinvestment of dividends, capital gains and other earnings when appropriate. Dividends and capital gains may be invested in money market funds or other cash equivalents pending reinvestment in other portfolio securities. • Clients and prospective clients should understand that past performance is no guarantee of future results. There is always the chance that market conditions or portfolio performance might deteriorate in the future, and clients may experience real capital losses in their managed accounts. • There were no investment strategies employed to obtain the results portrayed other than those strategies disclosed in Hays Advisory, LLC’s Form ADV or other disclosure brochure. The results portrayed are derived from the composite performance of all the discretionary Global ETFaccounts managed by Hays Advisory, including both the equity and fixed income portions of such accounts. • The Global ETF portfolio composite results portrayed during the periods are compared to the performance of MSCI All Country World Index. The MSCI ACWI (All Country World Index) Index is a free float-adjusted market capitalization weighted index that is designed to measure the equity market performance of developed and emerging markets. The volatility of the MSCI ACWI Index may be materially different from that of the performance composite. In addition, the composite’s holdings may differ significantly from the securities that comprise the MSCI ACWI Index. The MSCI ACWI Index has not been selected to represent the most appropriate benchmark to compare the composite’s performance, but rather is disclosed to allow for comparison of the composite’s performance to that of a well known and widely recognized index. You cannot invest directly in this Index.
Hays International ETF Portfolio For Illustrative Purposes Only. We are not soliciting or recommending any action based upon this material.
Hays International ETF Portfolio Performance: Annualized Returns* - Inception 2/1/06 QTR*YTD*200820072006*Inception* Int. ETF - Net 26.96 19.67 -44.45 29.31 17.23 0.22 Int. ETF -“Pure” Gross** 27.37 20.52 -43.82 30.60 18.30 1.32 MSCI ACW Excl. US 27.94 14.35 -45.25 17.10 18.88 -3.94 MSCI EAFE *** 23.765.63-45.09 8.62 16.29 -8.72 *All returns for periods less than one year have NOT been annualized. Since inception # is annualized. 2006 return is from 2/1/2006. **“Pure” gross of fees returns are supplemental to net returns. For wrap accounts, “pure” gross of fees returns reflect the deduction of expenses charged by the exchange traded funds but do not reflect the deduction of any other expenses, including trading costs. For non-wrap accounts, which represented 2.9% of the composite assets at the end of the period, “pure” gross of fees returns reflect the deduction of trading costs and expenses charged by the exchange traded funds but do not reflect the deduction of any other expenses. *** The MSCI All Country World Index Excl. US is the International Portfolio’s benchmark. We are presenting the EAFE returns for comparison only. For Illustrative Purposes Only. We are not soliciting or recommending any action based upon this material. Past performance is no indication of future results. Please see important disclosures at the end of this presentation.
Hays International ETF Portfolio American EuroPacific Growth 12.57% -40.5% 19.0% 14.97% Templeton Foreign 18.24% -46.1% 17.2% 14.03% Aim Intl Growth Fund 11.04% -40.0% 14.0% 18.77% Vanguard Int’l Growth 14.02% -44.83% 16.2% 17.82% Dodge & Cox Int Stock 16.07% -46.0 % 11.0% 20.16% Hays International ETF Portfolio (net) 19.67% -44.45% 29.31% 17.23% * Through 6/30/2009. ** Mutual fund returns calculated using daily Net Asset Value for the period displayed. From 2/1/06 - Fund YTD* 2008 2007 12/31/06** For Illustrative Purposes Only. We are not soliciting or recommending any action based upon this material. Past performance is no indication of future results. Please see important disclosures at the end of this presentation.
International ETF Portfolio Performance Disclosures • The recommended asset class portfolio constraints for the International ETF Composite strategy allow for a client’s portfolio to be invested in as much as 100% ETF equities with a minimum of 50% when market risk rises. While Hays Advisory’s goal is to always adhere to the maximum and minimum constraints, market conditions or other special situations may cause a greater variance. • International ETF composite assets as of June 30, 2009 were $3.35 million, which represented 0.37% of the firm’s total assets. Eleven percent of the assets in the composite were non-fee paying assets. Returns are calculated in U.S. dollars. • Client’s returns will be reduced by the advisory fees and any other expenses it may incur in the management of its investment accounts. Hays Advisory’s investment advisory fees are described in detail in Part II of its Form ADV. • The market value of Hays Advisory’s portfolios’ investments will fluctuate as the stock and bond markets fluctuate. Market risk may affect a single issuer, industry or sector of the economy or may affect the market as a whole. Stock market conditions vary from year to year, and can result in a decline in market value due to material market or economic conditions. • The net performance results portrayed reflect the deduction of advisory fees and other expenses, which the client would have paid during the periods shown. Prior to 2008, the composite contained a single, non-fee paying account. Net performance results were calculated hypothetically by deducting a 1% annual fee billed at 0.25% per quarter – Hays Advisory’s highest applicable management fee during the period – to reflect what a client may have paid during the periods shown. • The results portrayed reflect the reinvestment of dividends, capital gains and other earnings when appropriate. Dividends and capital gains may be invested in money market funds or other cash equivalents pending reinvestment in other portfolio securities. • Clients and prospective clients should understand that past performance is no guarantee of future results. There is always the chance that market conditions or portfolio performance might deteriorate in the future, and clients may experience real capital losses in their managed accounts. • There were no investment strategies employed to obtain the results portrayed other than those strategies disclosed in Hays Advisory, LLC’s Form ADV or other disclosure brochure. The results portrayed are derived from the composite performance of all the discretionary International ETF accounts managed by Hays Advisory, including both the equity and fixed income portions of such accounts. • The International ETF portfolio composite results portrayed during the periods are compared to the performance of MSCI All Country World X US Index. The MSCI ACWI (All Country World Index) ex-USA is a free float-adjusted market capitalization index that is designed to measure equity market performance in the global developed and emerging markets, excluding the United States. The volatility of the MSCI ACWI X US Index may be materially different from that of the performance composite. In addition, the composite’s holdings may differ significantly from the securities that comprise the MSCI ACWI X US Index. The MSCI ACWI X US Index has not been selected to represent the most appropriate benchmark to compare the composite’s performance, but rather is disclosed to allow for comparison of the composite’s performance to that of a well-known and widely recognized index. You cannot invest directly in this Index.
Hays Global and International ETF Portfolios • ETF portfolios created to take advantage of Global Opportunities • Advantages of ETFs vs Mutual Funds • Asset Allocation determined by Hays Model - Can raise cash • Relative Strength based quantitative process • Concentrated portfolios – 7 – 15 positions • Call 800-789-2194 or e-mail info@haysadvisory.com for availability and fee schedule.