Download
1 / 15
150 likes | 281 Views
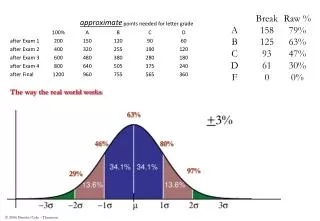
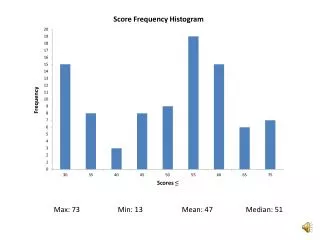
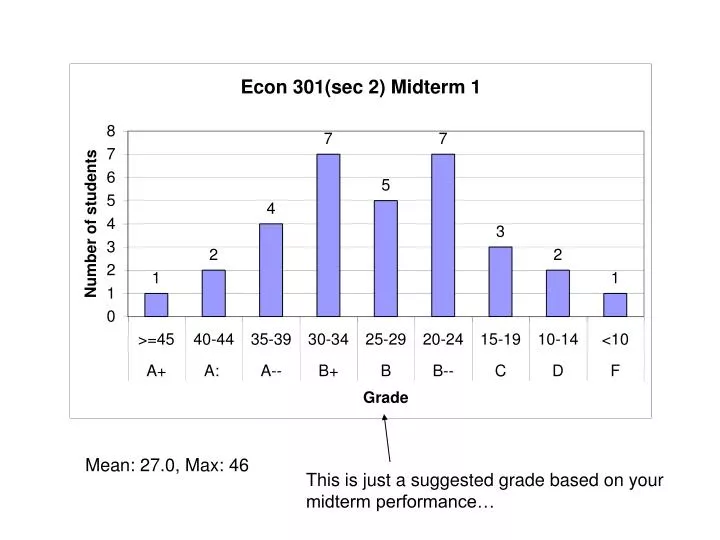
Mean: 27.0, Max: 46. This is just a suggested grade based on your midterm performance…. An answer key to Midterm I is available on our course website. If you feel you didn’t do well in the midterm, work with your classmates for homework and use my office hours to improve your understanding.

E N D
Mean: 27.0, Max: 46 This is just a suggested grade based on your midterm performance…
An answer key to Midterm I is available on our course website. • If you feel you didn’t do well in the midterm, work with your classmates for homework and use my office hours to improve your understanding.
Q 2 • At utility-maximizing consumption, marginal utility per dollar should be equalized over all goods! • If , then spend one more dollar on bread and one less dollar on juice; your utility will increase!
Q4 (a) - To draw demand curves, make sure you find the right intercepts and slopes! - When adding up the demands in West and East P., you should do so horizontally
Other Consumption ($) C U3 P B U2 A U1 Q Food ($) Q5 (a) • With cash instead of food stamps, the family chooses basket C on U3, which is preferred to point B on U2, the utility-maximizing consumption given food stamps.
Next Aplia HW: “The Cost of Production in the Short Run II” • due on Sunday Oct 8 • “The Cost of Production in the Long Run II” will be due next week
Q5 (b) Do food stamps ensure that low income families increase their consumption of food? Explain. You may use graphs. The answer is: Food stamps do NOT NECESSARILY ensure that low income families increase their consumption of food. The point of this question is that consumtion of a good does not always increase when income increases (i.e. the income effect can be negative, or equivalently, a good may be an inferior good.) This possible exists regardless of whether income increase is due to cash subsity or food stamps.
Other Consumption ($) P B A U2 U1 Q Food ($) Q5 (b) • If food is an inferior good over the relevant income range, then food consumption with food stamps (F2) can be less than that without (F1). F2 F1
Note that we are not saying food stamp is a bad idea (or a good idea) • Why food stamp could be an issue: recent trends in obesity and nutrition • Concerns about midterm? Let me know • Today my office hour is shorter than scheduled: 1:30-2:30.
Ch 7 Cost of production (cont.) • Recall the definition of various costs in the short run: • Total Cost (TC) • Fixed Cost (FC), Variable Cost (VC) • Marginal Cost (MC) • Average Fixed Cost (AFC), Average Variable Cost (AVC). Average Total Cost (ATC)
Average total cost (ATC) and Average variable cost (AVC)