Download
1 / 22
280 likes | 471 Views
Quality Controls: Get your instruments under control!. Gérald Grégori, Ph.D Purdue University Cytometry Laboratories

E N D
Quality Controls: Get your instruments under control! Gérald Grégori, Ph.D Purdue University Cytometry Laboratories Hansen Life Sciences Research Building, B050201 S. University Street,West Lafayette, IN 47907-2064,USAPh: +1(765) 494-0757Fax: +1(765) 494-0517e-mail: gregori@flowcyt.cyto.purdue.edu
Arbitrary units? Example : beads 10 m FS-PMT Voltage or gain - + Green Fluorescence (au) Forward Scatter (au) Forward Scatter (au) In flow cytometry scatter and fluorescence scales are in arbitrary units Scatter and Fluorescence values = function of set up(Voltage and gain of PMT)
Quality Control Tests Confidence in the instrument performance & Confidence in the results Use of a Standard Daily basis
What’s a Standard? • In theory : • A standard = a reference (defined by a user, a laboratory, or any aknowledged authority) • Properties accurately known(i.e., provided by the manufacturer) • In practice : • A manufactured particle (fluorescent beads: several sizes and excitation or emission wavelengths) • A biological particle (i.e., chicken and trout erythrocytes DNA measurements) • Used as an absolute reference for qualitative and quantitative comparisons
Quality Control of Instruments • Check the alignment of the optical pathway • Check the stability of the machine (Quality Control) • Test the capacities of the cytometer (flow rate) • Set up the Sorting (define the delay)
To check the alignment of the cytometer Beads 1.37 CVs < 2% expected for beads (1-10 μm) 1.93 Number of events If CVs > 2% check the alignment (flow cell or laser position, dichroic mirrors) 1.99 Intensity is constant with time Very useful on sorters Parameter intensity (au)
Example of bad alignment CV=4.5
Check the stability of the cytometer over time R1 R2 R4 R3 Once a protocol is defined for a particular standard bead solution Beads must always be plotted in the same regions Internal quality control Number of events Daily quality control Parameter intensity (au)
Problem of stability of the cytometer? • Many possible problems : • Leak in the fluidics modifiedflow rates; instability • Check for bubbles • Dirty flow cell • Laser dying beam intensity decreases • Bead solution too old or damaged photobleaching
Test the capacities of the cytometer 10000 Sample flow rate = 1mm3 s-1 1000 Measured concentration (beads mm-3) 100 10 1 1 10 100 1000 Dilution factor For example : Determination of the “dead time” of a Cytoron Absolute (Ortho Diagnostic Systems) Value furnished by the manufacturer = 2000 events s-1 Analysis of 1 μm fluorescent bead solutions (dilutions in cascade)
Droplet formation and timing Electric pulse + + + + + + + + + + Piezoelectric Transducer Input Flow cell laser Delay determined using fluorescent beads Interrogation point Delay (s) Last attached undulation First droplet Break-off point
Set up the delay with fluorescent beads Sort 50 beads on a slide with different delays (ex : from 29 to 35) Forward Scatter (au) beads Green Fluorescence (au) Beads (10 m) Slide Drop Count beads (epifluorescent Microscope) Delay value 29 30 31 32 33 • If you achieve 50 out of 50 beads, set the delay to that setting (ex: 31). • If beads are split between 2 drops, adjust the flow cell vertically Sorting process on the Altra (Coulter, USA)
Calibration The necessary step to convert arbitrary units into absolute physical values Calibration = adjustment of an instrument in order to express the results in some accurate physical measure. Calibrator = a material known to have accurate measured values for one or several characteristics
Example :Quantitation of antibody binding capacity of cell populations by flow cytometry Quantum Simply Cellular (QSC)
QSC Beads (Quantum Simply Cellular) Identical microbeads with various calibrated binding capacities of goat-anti-mouse IgG on their surface : • Antibody binding capacity (ABC) provided • by the manufacturer : • Blank. 0 MESF • 6851 MESF • 23379 MESF • 58333 MESF • 213369 MESF QSC, Cat. No. 815 Bangs Laboratories, Inc. www.bangslabs.com bead Ab site 3 4 Events 1 2 Blank Mean fluorescence intensity (au) MESF=Molecules of equivalent soluble fluorochrome
Quantum Simply Cellular BeadsCalibration Curve 250000 y = 32790x - 3926.1 2 R = 0.9981 200000 corresponding MESF 150000 fluorochrome (MESF) Molecules of equivalent soluble 100000 measure by FCM 50000 0 0 1 2 3 4 5 6 7 mean fluorescence- HLA-DR-FITC (au) Binding capacity of cells in your sample Courtesy of K. Rhageb
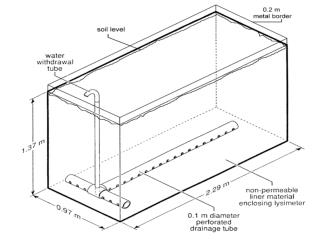
Absolute CountsDetermination of cell concentrationby flow cytometryGet the control of the volume analyzed Four different methods
I. Direct Absolute Count Cell concentration (# of events / volume) CYTORON ABSOLUTE (Ortho Diagnostic Systems) Sample To analyze a bead solution of known concentration Control of the fluidic
II. Weigh a Sample Analysis (Flow Cytometer) Weigh the sample before analysis (Weight W0) Weigh the sample after analysis (Weight W1) cell number (N) Sample Disadvantages Volume analyzed V = (W0 – W1)/ • Time consuming • Less accurate • (back flow of sheath fluid • in the sample) • Analysis in one run density Cell concentration = N/V
III. Add Beads in the Sample • Bead solution (known concentration) • count by microscopy • TruCountTM beads (BD) Add a very accurate volume calculate the bead concentration in the sample (1-10% of the expected density of the target cells) Volume analyzed (V) bead number Flow Cytometer cell number (N) Sample Cell concentration = N/V Stewart & Steinkamp, 1982, Cytometry 2 : 238-243
IV. Determination of the Flow Rate Hypothesis: flow rate (µl/s) through a flow cytometer = constant Bergeron et al, 2003, Cytometry 52B:37-39 Conclusion:volume (V) analyzed in a fixed time = constant No need to add beads in the samples. If N events are analyzed by the cytometer in the fixed time then cell concentration = N/V (cells/µl) Hint! • Analyzes must be done with the same flow rate • Volume accurately determined (microscopy, TruCountTM beads) and controlled • Beads not necessary in the sample, but can be used as internal standard
Conclusion Quality Control Tests are mandatory … To assess the alignment To assess and control instrument performance for quantitative and reproducible applications on any flow cytometer. References R.A. Hoffman, Current Protocols in Cytometry, 1997 : 1.3.1-1.3.19 J.C.S. Wood, Current Protocols in Cytometry, 1997 : 1.4.1-1.4.12 Cytometry, Volume 33, Number 2, 1998 :