Download
1 / 18
180 likes | 431 Views
Guidelines for Metrics Calculation. Defect Removal Efficiency %(DRE%)Phase-wise Defect Removal Efficiency %(DRE%) for the project Productivity Metrics for the project Defect Density Metrics for the project Effort Metrics Phase-wise Schedule Metrics Phase-wise

E N D
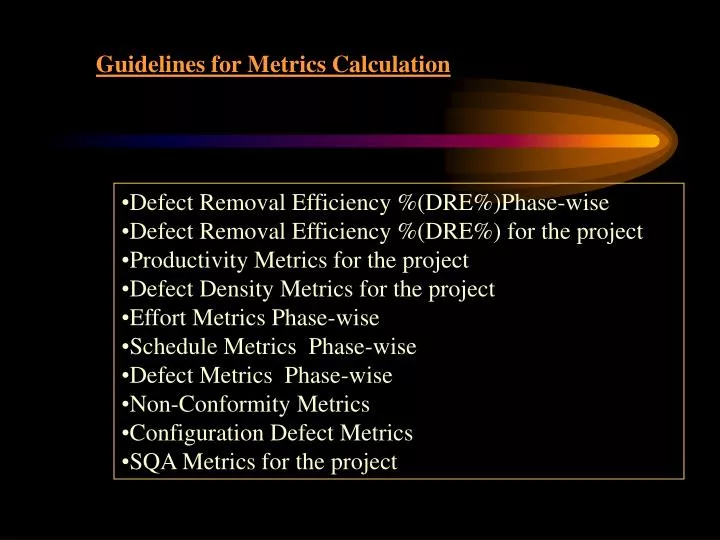
Guidelines for Metrics Calculation • Defect Removal Efficiency %(DRE%)Phase-wise • Defect Removal Efficiency %(DRE%) for the project • Productivity Metrics for the project • Defect Density Metrics for the project • Effort Metrics Phase-wise • Schedule Metrics Phase-wise • Defect Metrics Phase-wise • Non-Conformity Metrics • Configuration Defect Metrics • SQA Metrics for the project
Defect Removal Efficiency %(DRE%)Phase-wise • What is DRE and what do we conclude from DRE? • Definition: - DRE % indicates the effective identification and removal of defects both at phase-level and project-level • Conclusion from DRE %: - • If Over-all Project DRE is between 90%-100%, then the efficiency is said to be at High level. • If Over-all Project DRE is between 75%-90%, then the efficiency is said to be at Moderate level. • If Over-all Project DRE is below 75%, then the efficiency is said to be at Alarming level.
When will DRE be given to MR? • At the end of the project, DRE for each phase • and overall project is calculated and given to MR.
Defects Removed during a Phase DRE % = ------------------------------------------- X 100 Defects Removed till date
Example: Phase IntroducedRequirement Design Code/Unit Test Phase Deducted Requirement 10 -- -- Design 3 18 -- Coding 0 4 26 Testing 2 5 8 Customer 1 2 7
DRE % @ Requirement Phase = 10/(10+3+0+2+1) x 100 = 62.50 % DRE % @ Design Phase = (3+18)/(3+0+2+1+18+4+5+2) x100 = 60.00 % DRE % @ Coding Phase =(0+4+26)/(0+2+1+4+5+2+26+8+7) x100 = 54.54 % DRE % @ Testing Phase =(2+5+8)/(2+1+5+2+8+7) x 100 = 60.00 % Note: Here the total defects of one phase are carried over to next phase also.
What is the reason to carry over the bugs of one phase to another? For eg: There is some defects found in design phase, which are pertaining to Requirements. Typically these bugs should be removed during requirements phase itself. But since the bugs were not removed in requirement phase and is observed as bug pertaining to requirement phase during design phase, the bugs will be considered as count for both requirements and design phase.
Defect Removal Efficiency %(DRE%) for the project Total No. Of Defects before Release/Delivery DRE % = ------------------------------------------------------ X 100 Total No. Of Defects for the Project For the above mentioned example, Over-allDRE % = (10+3+2+18+4+5+26+8) ---------------------------------------- x 100 = 88.37 % (10+3+2+1+18+4+5+2+26+8+7)
Effort Metrics Phase-wise (Actual Effort – Planned Effort) Effort Slippage% = ---------------------------------------------- X 100 Planned Effort Note: The Efforts are always in terms of Hours If the figure is in negative, conclude that efforts put in the project is less. If the figure is in positive, conclude that efforts put in the project are more. In both cases please specify the reason while giving metrics to MR.
Metrics Collection Form For Effort Metrics -Phase Wise Project Code and Name: Requirement Design Planned Effort Code/Unit Test Phase Introduced Planned Effort Planned Effort Actual Effort Actual Effort Actual Effort Requirement Design Coding Testing Delivery / Release Prepared By : G. Parthasarathy Reviewed By (MR) : Sign Date : Data Given by : Sign/Date :
Schedule Metrics Phase-wise (Actual Schedule-Planned Schedule) Schedule Slippage% = ----------------------------------------------X 100 Planned Schedule Note: The schedule is always in terms of no. of days. If the figure is in negative, conclude that effects put in the project is less. If the figure is in positive, conclude that efforts put in the project are more. In both cases please specify the reason while giving metrics to MR.
Metrics Collection Form For Schedule Metrics -Phase Wise Project Code and Name: Requirement Design Planned Schedule Code/Unit Test Phase Introduced Planned Schedule Planned Schedule Actual Schedule Actual Schedule Actual Schedule Requirement Design Coding Testing Delivery / Release Prepared By : G. Parthasarathy Reviewed By (MR) : Sign Date : Data Given by : Sign/Date :
Defect Metrics Phase-wise Defect Metric for a Phase = The Total number of Bugs Identified during the Phase Note: For testing phase the bugs found during testing is considered and for other phases the review points are considered as defects.
Non-Conformity Metrics Total No. Of Non-Conformity Closed during the Quarter Non-Conformity Metrics = --------------------------------------------------------------------- Total No. Of Non-Conformity Raised during the Quarter
Configuration Defect Metrics Configuration Defect Metrics = Total Number of deviations mentioned in Configuration Audit Note: Here deviations indicate the NCs
SQA Metrics for the project No. Of Activities Completed SQA Metric =---------------------------------------------- No. Of Activities Planned Note: This metrics is given at the end of the project.
We can improve the Quality process by doing the metrics also. I request our Project Leaders to come forward to Provide data for the metrics to improve our Quality department. See you guys with some more stuff on metrics in next article G. Parthan