Download
1 / 1
10 likes | 162 Views
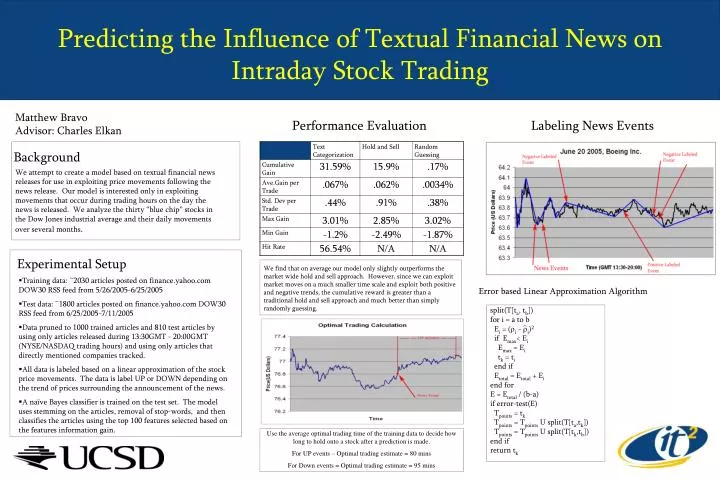
Predicting the Influence of Textual Financial News on Intraday Stock Trading. Matthew Bravo Advisor: Charles Elkan. Performance Evaluation. Labeling News Events. Background.

E N D
Predicting the Influence of Textual Financial News on Intraday Stock Trading Matthew Bravo Advisor: Charles Elkan Performance Evaluation Labeling News Events Background We attempt to create a model based on textual financial news releases for use in exploiting price movements following the news release. Our model is interested only in exploiting movements that occur during trading hours on the day the news is released. We analyze the thirty “blue chip” stocks in the Dow Jones industrial average and their daily movements over several months. Experimental Setup We find that on average our model only slightly outperforms the market wide hold and sell approach. However, since we can exploit market moves on a much smaller time scale and exploit both positive and negative trends, the cumulative reward is greater than a traditional hold and sell approach and much better than simply randomly guessing. • Training data: ~2030 articles posted on finance.yahoo.com DOW30 RSS feed from 5/26/2005-6/25/2005 • Test data: ~1800 articles posted on finance.yahoo.com DOW30 RSS feed from 6/25/2005-7/11/2005 • Data pruned to 1000 trained articles and 810 test articles by using only articles released during 13:30GMT - 20:00GMT (NYSE/NASDAQ trading hours) and using only articles that directly mentioned companies tracked. • All data is labeled based on a linear approximation of the stock price movements. The data is label UP or DOWN depending on the trend of prices surrounding the announcement of the news. • A naïve Bayes classifier is trained on the test set. The model uses stemming on the articles, removal of stop-words, and then classifies the articles using the top 100 features selected based on the features information gain. Error based Linear Approximation Algorithm split(T[ta, tb]) for i = a to b Ei = (i - i)2 if Emax< Ei Emax = Ei tk = ti end if Etotal = Etotal + Ei end for E = Etotal / (b-a) if error-test(E) Tpoints = tk Tpoints = Tpoints U split(T[ta,tk]) Tpoints = Tpoints U split(T[tk,tb]) end if return tk Use the average optimal trading time of the training data to decide how long to hold onto a stock after a prediction is made. For UP events – Optimal trading estimate = 80 mins For Down events = Optimal trading estimate = 95 mins