Download
1 / 20
200 likes | 344 Views
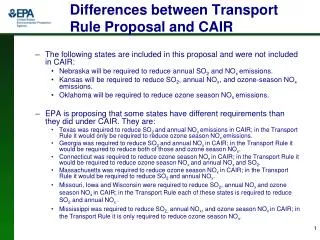
Clean Air Interstate Rule (CAIR). Development of Regionwide Emission Reduction Requirements Office of Air and Radiation April 2005. Overview of The Presentation. This presentation: Describes the method we used to determine the CAIR regionwide SO 2 and NOx caps.

E N D
Clean Air Interstate Rule (CAIR) Development of Regionwide Emission Reduction Requirements Office of Air and Radiation April 2005
Overview of The Presentation This presentation: • Describes the method we used to determine the CAIR regionwide SO2 and NOx caps. • Discusses the method we used to determine the timing of the CAIR control phases. • Note: The method for dividing regionwide caps into State SO2 and NOx budgets will be discussed in the following presentation, after the lunch break. • This presentation also includes a summary of the impacts of CAIR (e.g., projected capacity of retrofits, emission reductions, future electricity and natural gas prices, and other impacts).
Summary of Regionwide Caps and Timing • CAIR implements a two-phase NOx and SO2 emission reduction program with declining caps, affecting a total of 28 States and DC. • Regionwide caps are as follows (assuming all States choose to obtain reductions by controlling only EGUs): • SO2 annual caps: 3.6 million tons in 2010 and 2.5 million in 2015 • Affects 23 States and DC • NOx annual caps: 1.5 million tons in 2009 and 1.3 million in 2015 • Affects 23 States and DC • NOx ozone season caps: 0.6 million tons in 2009 and 0.5 million in 2015 • Affects 25 States and DC
States controlled for fine particles (annual SO2 and NOx) States controlled for ozone (ozone season NOx) States controlled for both fine particles (annual SO2 and NOx) and ozone (ozone season NOx) States not covered by CAIR Geographic Coverage of CAIR
How Did We Develop the Regionwide Caps and Determine the Timing? • First, we developed target regionwide EGU emissions caps for SO2 and NOx. • Next, we evaluated the costs-per-ton-of-emission-reductions for the target regionwide caps, and determined that the caps are highly cost effective (assuming controls on EGUs, implemented through regionwide cap and trade programs). • And, we evaluated engineering factors (e.g., availability of boilermaker labor) and financial factors that affect timing of pollution control retrofits, and determined that it is feasible to achieve the target regionwide caps in the CAIR time frame. • Note: Although we developed the regionwide caps based on the application of highly cost-effective controls on EGUs, States have flexibility on how to achieve the required reductions.
How Did We Develop Target Regionwide Caps? • CAIR regionwide caps were developed with the following goals in mind: • (1) Achieve significant emission reductions that will help bring areas into attainment with the air quality standards. • Using a two-phased program, getting as much reductions as feasible for the first phase, and assuring that the ultimate control levels can be achieved using highly cost-effective controls. • (2) Avoid creating significant impacts to the electric power sector (e.g., retail electricity prices, coal industry impacts). • For almost a decade, EPA has been involved in efforts to develop regional and national multipollutant reduction programs (including the Clean Air Power Initiative, and analysis in support of the Clear Skies Act). • Through that experience, we developed a good general feel for the amounts of regionwide reductions that could be appropriate for CAIR.
How Did We Develop Target Regionwide Caps? Target Regionwide SO2 Caps: • We had a good sense that SO2 caps based on the following would be appropriate target amounts for further evaluation: • A first phase cap based on about a 50% reduction from title IV levels. • A second phase cap based on about a 65% reduction from title IV levels. • These percent reductions are essentially the same as in the CSA. • We had a good sense that NOx caps based on multiplying recent historic EGU heat input by NOx emission rates would create appropriate target amounts for further evaluation, considering the following NOx rates: • A first phase cap based on the assumption that an average emission rate of less than 0.15 lb/mmBtu might be feasible. • A second phase cap based on the assumption that an average emission rate on the order of 0.12 might be highly cost effective. • These rates are similar to the rates used to develop the eastern caps in the CSA. • We did not include a direct calculation for growth because: • The use of growth calculations in the NOx SIP Call lead to difficulties. • Incorporating a growth calculation would inflate the caps leading to fewer reductions. Target Regionwide NOx Caps:
How Did We Develop Target Regionwide Caps? How did we calculate target regionwide annual EGU SO2 caps? • For 2010: • Added together all the title IV Phase-II allowances for the 23 States + DC in the CAIR PM2.5 region* • Made a 50 percent reduction to create the regionwide cap • 7.2 million tons X 50% = 3.6 million tons • For 2015: • Added together all the title IV Phase-II allowances for the 23 States + DC in the CAIR PM2.5 region* • Made a 65 percent reduction to create the regionwide cap • 7.2 million tons X 35% = 2.5 million tons * In the 23 States + DC that make up the CAIR PM2.5 region, the title IV Phase-II allowances total 7.2 million tons. For comparison, nationwide the title IV Phase-II allowances total 8.9 million tons.
How Did We Develop Target Regionwide Caps? How did we calculate target regionwide annual and ozone season EGU NOx caps? • Annual NOx cap for 2009: • We looked at annual heat input by State from the years 1999-2002 for units affected by the Acid Rain Program, for each of the 23 States + DC in the CAIR PM2.5 region. • For each affected State, we selected the year (from 1999-2002) with the highest ARP heat input, then summed the selected high heat inputs to create a regionwide heat input amount. • We multiplied the regionwide heat input amount by 0.15 lb/mmBtu to create the regionwide cap. • Annual NOx cap for 2015: • Same method as for the 2009 cap, except that we multiplied the regionwide heat input amount by 0.125 lb/mmBtu to create the regionwide cap. • Ozone season NOx caps for 2009 & 2015: • Same method as for the annual NOx caps, except we used ozone season heat inputs, for each of the 25 States + DC that are in the CAIR ozone region.
Evaluation of Highly Cost-Effective Controls on EGUs How did we evaluate cost effectiveness of the target regionwide caps? • Using IPM*, we modeled the target regionwide SO2 and NOx caps (assuming controls on EGUs, implemented through cap and trade) to estimate the marginal and average costs-per-ton-of-reduction of these target caps. • We compared the estimated costs-per-ton for the target caps to the costs-per-ton of other regulatory actions. To make this comparison, we developed reference lists of average and marginal control costs from other recent SO2 and NOx actions. • Based on IPM modeling, control costs for the CAIR target regionwide caps are at the low end of the reference lists of controls, therefore the target caps are highly cost effective. • For example, IPM predicts the marginal cost of SO2 reductions in 2015 to be about $1,000 per ton. The range of SO2 control costs in the reference list varies from $600 to $2,200 per ton. • This method -- evaluation of highly cost-effective controls by comparison to reference lists of other recent control actions -- is the same as was used in the NOx SIP Call. * The Integrated Planning Model (IPM) is a dynamic, linear-programming model used to examine air pollution control policies for SO2 and NOx throughout the contiguous United States for the entire power system. Costs shown are in 1999 dollars.
Evaluation of Highly Cost-Effective Controls on EGUs • After the CAIR proposal, some commenters suggested that EPA should include a calculation for growth in EGU heat input in determining the regionwide NOx caps. Others suggested we should adjust the regionwide NOx caps to include heat input from non-Acid Rain Program units. • We evaluated the cost effectiveness of CAIR using IPM, which incorporates assumptions for electricity demand growth and thus heat input growth. Based on IPM modeling, the CAIR NOx caps will be highly cost effective in 2009 and 2015, under the assumed conditions of electricity demand growth. • Although the target regionwide caps were calculated using heat input from ARP units only, we tested the caps using IPM, which includes all EGUs -- not only ARP units -- and determined the caps to be highly cost effective. • The future heat input amounts projected by IPM -- based on electricity growth and including all CAIR EGUs -- are greater than the heat input amounts we used to calculate target regionwide caps. And, the future average NOx emission rates projected by IPM for all CAIR EGUs (including non-ARP units) are lower than the rates we used to calculate target caps. • 2009: Used 0.15 lb/mmBtu to calculate caps, projected average emission rate will be 0.14 lb/mmBtu. • 2015: Used 0.125 lb/mmBtu to calculate caps, projected average emission rate will be 0.11 lb/mmBtu.
How Did We Determine the Timing of the Control Phases? • The emission controls that will be most cost effective to meet the CAIR requirements are retrofit scrubbers and SCRs on coal-fired EGUs, therefore we focussed our analysis on factors that affect the timing for installing these emission controls. • Scrubber and SCR retrofits require a large pool of specialized labor resources -- in particular boilermakers* -- the availability of which will be a major limiting factor in the amount and timing of reductions. • Because boilermaker labor is a major limiting factor, the main focus of our analysis is on determining the availability of boilermakers. • The two-phased CAIR schedule allows the implementation of as much of the controls as feasible by an early date, with the remaining controls installed by the later date. * Boilermakers are skilled laborers that perform various specialized construction activities, including welding and rigging, for boilers and high pressure vessels.
Evaluation of Boilermaker Labor Availability How did we evaluate the availability of boilermaker labor for CAIR retrofits? • Using IPM, we projected the amounts of scrubber and SCR retrofits that would be installed for the two CAIR phases. • We estimated the availability of boilermaker labor during the period when construction of CAIR retrofits will occur and determined that adequate labor will be available -- more about this analysis on the next slide. • We analyzed the availability of boilermaker labor using conservative assumptions, in order to provide certainty that adequate labor will be available when needed for CAIR. • After the CAIR proposal, we received detailed technical comments about the boilermaker labor analysis: • Some argued that the controls could not be implemented until later than proposed • Others stated that the controls could be implemented sooner than proposed. • For the final CAIR, we did additional research and analysis to verify availability of boilermakers, incorporating some assumptions that were suggested by commenters. • Based on the additional analysis, we determined it is feasible to shift the first NOx phase from 2010 (as it was proposed) to 2009. The SO2 schedule did not change.
Evaluation of Boilermaker Labor Availability • To estimate availability of boilermaker labor for CAIR, we considered the following: • Overall population of boilermakers • Percent of boilermaker population available to work on CAIR retrofits • Average hours worked by a boilermaker per year • Duty rates (boilermaker-years per MW of retrofits installed) • To verify our assumptions about boilermaker availability, we held discussions with the International Brotherhood of Boilermakers, the U.S. Bureau of Labor Statistics, and the National Association of Construction Boilermaker Employers. • Our analysis demonstrates that adequate boilermaker labor will be available to install the anticipated retrofits to meet the CAIR compliance schedule. • Emission reductions will actually begin prior to the compliance dates: • Early reductions for CAIR ozone season NOx program and SO2 program begin immediately because NOx SIP Call and title IV allowances can be banked into CAIR. • The CSP provides incentives for early reductions for CAIR annual NOx program.
Summary of EGU Regionwide Caps, Projected Emissions, and Reductions (million tons) Annual SO2 and NOx (23 States + DC) Ozone Season NOx (25 States + DC)
Summary of Projected Coal Capacity with Pollution Control Retrofits under CAIR • Total Coal Capacity Projected, with CAIR: • 305 GW in 2010 • 304 GW in 2015 • 320 GW in 2020
Summary of Other Projected Impacts CAIR 2003 2000 2010 2015 275 Appalachia 299 306 306 135 Interior 131 165 191 526 West 475 607 586 National 905 1,078 1,083 936 Natural Gas Prices Regional Retail Electricity Prices $/mmBtu Note: Henry Hub prices Generation Mix Coal Production for Electricity Generation (million tons) Other 2020 Renewables 2015 2010 Hydro Nuclear Gas/Oil Coal Note: Retail prices for 2000 are from AEO2003. Natural Gas prices for 2000 are from Platts GASdat. All other data is from EPA’s Integrated Planning Model.
Interactions between the CAIR SO2 Program and Title IV: Banked SO2 Allowances How will banked title IV allowances be treated under CAIR? • Pre-2010 banked title IV allowances can be used at a 1:1 ratio for CAIR. • This facilitates early reductions, and leads to a smoother curve of emission reductions (glide-path) toward the CAIR caps. • We anticipate that sources will carry forward roughly 6-7 million banked SO2 allowances into CAIR as a result of the existing title IV bank and additional early reductions. • Because of banking, the CAIR regionwide SO2 caps will not be met in 2010 and 2015, as sources will gradually deplete the bank to help with compliance for CAIR. What are the impacts of this interaction?
Nationwide SO2 Emissions from the Power Sector Source: EPA * The caps and emissions reflected here, beginning in 2010, reflect region-wide CAIR data. The Title IV cap and emissions (2009 and prior) reflect nationwide data.
For Further Information • Section IV in the final CAIR preamble discusses the cost effectiveness and feasibility analyses, see www.epa.gov/cair • The following Technical Support Documents provide additional information, see www.epa.gov/cair • Boilermaker Labor Analysis and Installation Timing • Modeling of Control Costs, Emissions, and Control Retrofits for Cost Effectiveness and Feasibility Analyses • Regional and State SO2 and NOx Emissions Budgets • For State-by-State Summaries of projected CAIR impacts, see www.epa.gov/cair/where.html • For IPM Documentation, see www.epa.gov/airmarkets/epa-ipm