Download
1 / 27
270 likes | 368 Views
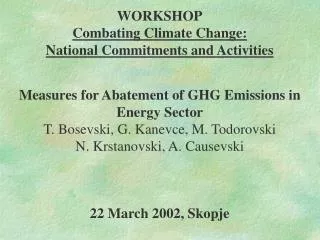
WORKSHOP Combating Climate Change: National Commitments and Activities. National Inventories and Future Projections of GHG Emissions Research Center for Energy, Informatics and Materials (ICEIM) Macedonian Academy of Sciences and Arts (MANU). 22 March 2002, Skopje. 1.Team Structure.

E N D
WORKSHOP Combating Climate Change: National Commitments and Activities National Inventories and Future Projections of GHG Emissions Research Center for Energy, Informatics and Materials (ICEIM) Macedonian Academy of Sciences and Arts (MANU) 22 March 2002, Skopje
1.Team Structure Project Leader: Akad. Jordan Pop-Jordanov Project Coordinator: Akad. Tome Bosevski Executive Secretary: Dr. Natasa Markovska
2. Inventory of GHG emissions 2.1 Sector ENERGY CO2 emissions (year 1998)
Energy Industries Fugitive Emissions Manufacturing Industries and Construction Transport Commercial/Institutional & Residential Agriculture / Forestry / Fishing 1998 61.5 17.2 5.7 10.6 3.3 1.8 1997 61.0 17.0 6.0 10.7 3.4 1.8 1996 60.3 16.7 6.0 11.5 3.7 1.8 1995 61.3 17.2 5.5 10.9 3.5 1.7 1994 60.9 17.0 5.6 11.2 3.6 1.7 1993 58.0 15.9 7.3 12.2 4.4 2.2 1992 60.0 16.4 7.8 9.2 4.6 2.1 1991 58.5 15.9 8.2 10.4 4.7 2.3 1990 58.9 16.1 8.2 10.0 4.7 2.3 [%] 0 20 40 60 80 100 Subsectorial contribution to CO2-equivalent emissions
2.2 Sector INDUSTRIAL PROCESSES Subsectorial CO2-equivalent emissions
2.3 Sector AGRICULTURE [kt] Subsectorial CO2-equivalent emissions
(%) Contribution of CH4 and N2O to CO2-eq. emissions
(%) Subsectorial contribution to CO2-equivalent emissions
2.4 Sector LUCF Removals of CO2 (kt/yr) for the period 1990 - 1998 Balance between removals and releases of CO2 (kt CO2) for the period 1990 – 1998
2.5 Sector WASTE Subsectorial CO2-equivalent emissions
2.6 Integrated results Sectorial CO2-equivalent emissions
3. Evaluation of input data 3.1 Sector ENERGY
4. Projections of GHG emissions Subsectorial CO2-equivalent emissions