Download
1 / 19
200 likes | 319 Views
Genetic Effects of Stress in Vervet Monkey. Olivera Grujic Dr. Eleazar Eskin’s Lab, UCLA Dr. Nelson Freimer’s Lab,UCLA SoCalBSI, 2008. Project Importance. Evaluate biomedical bases of inter-individual differences in response to stressor. Stress Related Diseases: Depression

E N D
Genetic Effects of Stress in Vervet Monkey Olivera Grujic Dr. Eleazar Eskin’s Lab, UCLA Dr. Nelson Freimer’s Lab,UCLA SoCalBSI, 2008
Project Importance • Evaluate biomedical bases of inter-individual differences in response to stressor. • Stress Related Diseases: • Depression • Post Traumatic Stress Disorder Response to stress has genetic component!
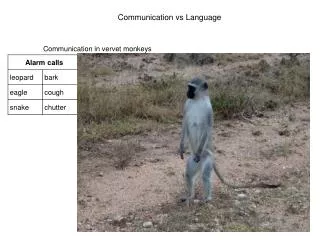
Challenging of Studying Genetic Factors of Stress • Complex trait • Experiments in humans Need: Model organism that reacts to stress!
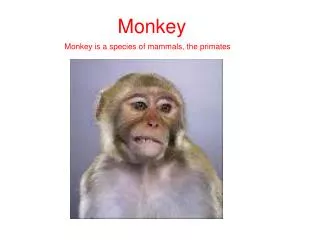
Vervet Research Colony African Vervets (Chlorocebus aethiops sabaeus) • Inbred pedigree • 1000 members • Small number brought to the Carribean (300-400 years ago) • 57 wild-caught brought from St. Kitts to UCLA (1975-1989) • Colony moved from UCLA to Wake Forest (in January 2008)
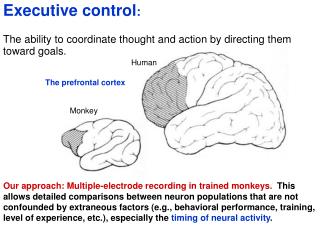
Advantages of Researching Vervet over Human Population • Same stressor • Controlled environment • Good quality of tissue • Simultaneous effect in multiple organ systems • Highly informative pedigree • Vervet genetic map suitable for QTL mapping Freimer NB, et al. A quantitative trait locus for variation in dopamine metabolism mapped in a primate model using reference sequences from related species. Proc Natl Acad Sci U S A. 2007 Oct 2;104(40):15811-6. Epub 2007 Sep 20. Jasinska AJ, et al. A genetic linkage map of vervet monkey. (2007) Mamm Genome 18:347–360.
Data Collection Moving can be stressful. Vervet Colony exposed to a major stressor - all of them were moved under the same conditions, at the same time (in controlled way)! • Before move: • Blood samples from ~380 individuals • Brain tissue from 12 individuals • After move: • Blood samples from ~340 individuals • Brain tissue from 4 individuals Goal: Use samples to determine effects of stress in terms of: • gene expression profiles • interindividual differences
Challenges • No vervet genome and no vervet microarrays • Not much known about gene expression in primate brain • Mostly collecting blood data • Available expression data only before move
First Task • Assess quality of DNA probes • Identify inter-species sequence differences * Vervet BAC end sequences submitted to NCBI in batches
Probe Comparison Workflow Illumina BeadStudio Output File 341,172 Vervet Sequences Extract and Add Headings Convert to 22184 Probe Sequences Vervet Database Compare Using BLAST BLAST Output File Parse Top Hit for Each Probe Count Frequency Probes per Nucleotides Matched
Length 50 197 49 225 48 186 47 160 46 146 45 121 44 104 43 70 42 81 41 55 40 57 39 45 38 44 37 43 36 43 35 64 34 44 33 41 32 45 31 47 30 35 29 39 28 51 27 61 26 67 25 104 24 94 23 208 22 322 21 638 20 1198 19 1662 18 3382 17 6286 16 5100 15 1046 14 0 Freq ResultsProbe Comparison 15 nucleotides 5% 16 nucleotides 23% 20 nucleotides 5% 19 nucleotides 8% 18 nucleotides 15% 17 nucleotides 28%
Second Task • Characterize regional gene expression in vervet brain • Characterize group of genes with low gene expression variability between brain and blood • Approach: • Cluster expression data from blood and following brain tissues: • Head of Caudate • Cereballar Vermis • Hippocampus • Frontal Pole • Dorsolateral Prefrontal Cortex • Orbital Frontal Cortex • Pulvinar • Occipital Pole Obtain a list of genes where more than 75% of variability is due to inter-individual differences!
Blood Head of Caudate Cerrebalar Vermus Hippocampus Frontal Pole DLPFC Orbital Frontal Pulvinar Occipital pole
Results: Clustering Individuals Tissue Type
Blood Tissue Samples Genes Cluster1 Cluster2
Future Work • Third Task: brain to blood mapping • Fourth Task: compare pre-move and post-move expression data
Acknowledgments • UCLA Dr. Eleazar Eskin Dr. Nelson Freimer Dr. Ania Jasinska My Labmates • SoCalBSI Dr. Jamil Momand Dr. Sandra Sharp Dr. Nancy Warter-Perez Dr. Wendie Johnston Dr. Beverly Krilowicz Dr. Silvia Heubach Dr. Jennifer Faust Ronnie Cheng SoCalBSI 2008 Interns • Funded by: