Download
1 / 29
290 likes | 389 Views
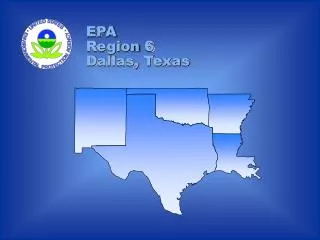
Integration of Models in a Risk Assessment Framework – Regional Air Impact Modeling Initiative (RAIMI). U.S. EPA Region 6 Multimedia Planning and Permitting Division September 2003. COMMUNITY LEVEL ASSESSMENTS - REGIONAL PERSPECTIVE. Significant Intermingling of Industry and Neighborhoods

E N D
Integration of Models in a Risk Assessment Framework – Regional Air Impact Modeling Initiative (RAIMI) U.S. EPA Region 6 Multimedia Planning and Permitting Division September 2003
COMMUNITY LEVEL ASSESSMENTS - REGIONAL PERSPECTIVE • Significant Intermingling of Industry and Neighborhoods • National Scale Studies Continue to Flag Problems in Several Region 6 States • Scale of Issues Too Large to Ignore • Holistic Answer Needed to Bottom-Line Questions • Multi-program/Cross Media • Receptor-based Approach S-2
REGION 6'S SOLUTIONFOR DEVELOPING CAPABILITIES TO DO LOCALIZED ASSESSMENTS Regional Air Impact Modeling Initiative (RAIMI) • Risk-based Prioritization Tool Set and Project Platform to Develop Multi-media Solutions to Environmental Problems
REGIONAL AIR IMPACT MODELING INITIATIVE (RAIMI) Design Strategy considerations • Provide A Consistent Means By Which Permitting Authorities Could Account For And Assess Potential Health Effects To Multiple Contaminants From Multiple Sources • Evaluate And Demonstrate Protectiveness Of Cross Program (e.g., RCRA, CAA, Exempt) Permitting Decisions And Support Holistic, Tailored Permit Strategies • Calculate And Track Risks From Literally Hundreds Of Sources And Contaminants • Provide Necessary Information To Prioritize And Identify Solutions, For Sources Resulting In Unacceptable Risks, At A Community Level Of Resolution, And Generated In A Fully Transparent Fashion Such That Risk Levels Are Traceable To Each Contaminant, Each Pathway, And Each Source
DETERMINING PROJECT OBJECTIVES Guiding Factors in Determining Project Objectives - USABILITY and UTILITY • Defensible-relies on approved methods • Numerically correct and consistent • Time efficient (month vs. year timeframe to complete) • Cost efficient (tens of thousands vs. hundreds of thousands) • Flexible-analyze variations/what if’s • Provides interim utility (useful data for trending, flags potential problems, etc.) • Directly applicable to end user’s needs • Directly supports solution implementation
RAIMI Tools and Capabilities Emissions Inventories • State/ Federal Databases (e.g., PSDB, NTI, TRI) • Database Digestion / Formatting tools – Data Miner • Emissions Visualization • Emissions Tracking Database (ETD) Air Dispersion Modeling • Pre-processing tools – AMP • Unit Emission Rate • Universal Grid Results and Solutions Management • Source/Unit Specific • GIS Platform (Risk-MAP) enhances: - risk communication - risk management - data gap evaluation • Bounding/Trending • Waste Minimization
EMISSIONS CHARACTERIZATION Example Objectives Specific to Emissions Characterization • Obtain necessary data as inputs to complete air and risk modeling; • Obtain resolution and quality of data to support source-specific prioritization and decision making; • Identify and track key source attributes to support trending analysis • Support attribution profiling (source/contaminant/exposure pathway)
EMISSIONS CHARACTERIZATION Emissions Data Needs
RAIMI COMPONENTS • Emissions Characterization Component • DATA MINER • Emissions data query tool • Used to extract data from extremely large • emissions databases • Exports data directly to GIS platform • Useful for visually displaying emissions data
Data Miner – Emissions analysis tool developed as part of RAIMI Port Neches Beaumont Port Arthur 3D Representation of Emissions Jefferson County, Texas – Non-Methane VOCs
RAIMI COMPONENTS Emissions Characterization Component Cont., ETD: Emissions Tracking Database • String of inter-linked database tables • Database structure and functionality designed to support cumulative-type assessments requiring large capacity and high resolution of results for solution management
Geo-locationEmissions Characterization Component UTM NAD 27 Locations – Incorrect! UTM NAD 83 Locations – Correct!
AIR MODELING Selection Criteria for Air Model Comparison of Model Capabilities:
RAIMI COMPONENTS Air Modeling Component • “Single-pass” air modeling for each source • Provides all necessary air modeling data to support current and anticipated future risk modeling needs • “Unit emission rate” enables one set of model runs for modeling each emission source to accommodate any combination of emissions scenarios (such as reported actual emissions, permitted allowable emissions, revised quantities of emissions due to operational changes, or inclusion of new contaminants in the emissions profile) • “Emissions partitioning” provides phase-specific modeling runs (vapor, particle, particle-bound, mercury)
RECEPTOR GRID RAIMI COMPONENTS Air Modeling Component Applies “Universal Grid” • Standardized Geographic Coordinate System - all data is stored in NAD 83 Latitude/Longitude curvilinear. • As needed by applications, data is projected into required coordinate system (air model component is performed in UTM rectilinear coordinates, and results are presented in UTM) • Point-to-Point Alignment of Calculation Nodes - all grid nodes in the source-specific air model runs are specified at a 3-arc-second intersection to avoid data interpolation
RAIMI COMPONENTS Air Modeling Component AMP (Site Characterization Tool) • Processes source specific site parameters • Create air model input files • Creates universal grid with terrain elevations surrounding each source • Processes Met files using EPA’s Meteorological Processor for Regulatory Models (MPRM) AIR2GIS • Converts air modeling plot files for import into GIS platform Air Dispersion Model (ISCST3, AERMOD, CALPUFF)
Selection Criteria for Risk Model - Comparison of Model Capabilities RISK MODELING
RAIMI COMPONENTS Risk Modeling Component – Risk-MAP • Risk-modeling module that work as an extension for ArcView 8.3. • Capitalizes on the project management, data-analysis and presentation functions currently integrated into the ArcView GIS platform • Calculates exposure pathway specific values in a spatially layered data environment • Supports capacities typically required of cumulative type studies • Offers custom visual displaying of interim and final results in traditional (tabular, etc.) and mapped (isopleths, spatial attributes, attribution tracking, etc.) formats to support solution consideration, implementation, and tracking
Cumulative Cancer Risk Contours with Source Specific Attribution Profile for Residential Hotspot Groves Jefferson County, Texas Cumulative Inhalation Cancer Risk Profile for Residential Hotspot Beaumont Nederland
Cumulative Cancer Risk Contours with Source Specific Attribution Profile for Residential Hotspot - (Zoom) Jefferson County, Texas Cumulative Inhalation Cancer Risk Profile for Residential Hotspot
Source Attributes for Conducting Legal Review to Support Solutions Management Source Attribute Table Source Attribute Table Account No. Account No. JE0017A JE0017A Account Name Ameripol Synpol Corp. Account Name Ameripol Synpol Corp. Site Name WasteWater Site Name Trap 4 – XS99 Facility Name Waste water process N1 Facility Name Styrene Process Unit Source Type Fugitive Plant ID Tank Sector 9989A Point Name WSTWTR DISCH TO RT Point Name Flare - NE1 Unique Point Name JE0F011 Unique Point Name JE0F00M EPN Wastewater EPN T-ESTY FIN F-WWATER FIN FLARE-ESTY Permit Status RCRA – Permit No. 988A Permit Status Grandfathered SIC Code 4534339 SIC Code -- Facility Contact Bob Smith – 222-222-2222 Facility Contact Bob Smith – 222-222-2222 Emissions Profile (TPY) Emissions Profile (TPY) Contaminant Actual Annual Actual Allowable Contaminant Actual Annual Actual Allowable Aniline 12.5 12.5 Formaldehyde 17.2 12.5 Benzene 5.5 5.5 Benzene 1.6 5.5 1,3Butadiene 11.8 20.5 1,3Butadiene 1.8 20.5 Carbon Tetrachloride 6.3 6.3
Nighttime Population Distribution Land Scan USA Population Data Diurnal population distribution is critical to understanding the localized nature of exposure. LandScan More than 160,000 people occupy this downtown tract during a typical workday. The same area is almost deserted during nighttime hours. Daytime Population Distribution
RAIMI – Solutions Management and Tracking Component • Prioritize Sources – Select source type, contaminant, neighborhood, facility • Verification – Verify Source location, emission profile, toxicity factors • Refinement– Identify data gaps, secondary formation, bounding analysis • Legal Review – Determine permit status, source status, operating conditions
RAIMI – Solutions Management and Tracking Component Cont., • Facility Involvement – Solicit facility data, cooperative agreement • Identify Risk Management Options – Determine acceptable risk levels, review options • Implement and Track Solution and Outcomes – Perform trending analysis, support GPRA goals